

Analyse Facial Expression With CNN & DA
We are human because of our emotions. Our daily routines, our social interaction, our attention, perception, and our memory are affected by them.

We can tell a lot about our emotions by looking at our faces. Laughing and crying allow others to see our emotions through changes in key features of the face, such as our eyes, brows, nostrils, and lips.
As a result, computer-based facial expression recognition mimics our human coding skills quite impressively, since it can capture raw, unfiltered emotional responses to any emotionally engaging content. But what is facial expression recognition?
The answers are here. Getting the knack of emotion recognition and research into emotional behaviour is all you need with this definitive guide to facial expression analysis. It’s never too late to start.
Data
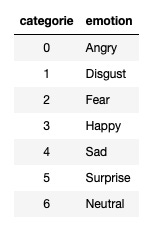
Images of grayscale faces measuring 48x48 pixels are included in the data. The faces have been automatically registered so that each image has about the same amount of space occupied by the face. Based on the emotion shown by a face, you must categorize it into one of seven categories:
The predicted results are compared with given labels using a simple CNN model.
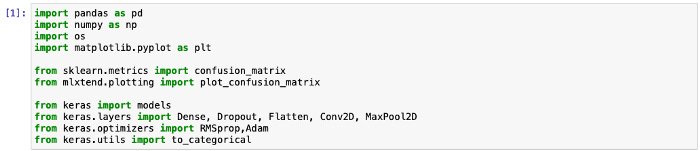
Libraries
A few standard libraries and packages of sklearn and keras are loaded.
Path to files
Define the input path and show all files.

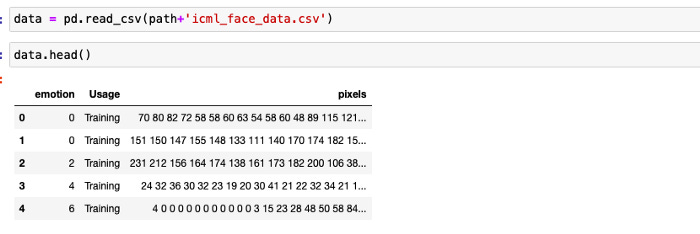
Load the data
Functions
We define some helper functions to prepare and plot the data.
def prepare_data(data):
    """ Prepare data for modeling
        input: data frame with labels und pixel data
        output: image and label array """

    image_array = np.zeros(shape=(len(data), 48, 48))
    image_label = np.array(list(map(int, data['emotion'])))

    for i, row in enumerate(data.index):
        image = np.fromstring(data.loc[row, ' pixels'], dtype=int, sep=' ')
        image = np.reshape(image, (48, 48))
        image_array[i] = image

    return image_array, image_labeldef plot_examples(label=0):
    fig, axs = plt.subplots(1, 5, figsize=(25, 12))
    fig.subplots_adjust(hspace = .2, wspace=.2)
    axs = axs.ravel()
    for i in range(5):
        idx = data[data['emotion']==label].index[i]
        axs[i].imshow(train_images[idx][:,:,0], cmap='gray')
        axs[i].set_title(emotions[train_labels[idx].argmax()])
        axs[i].set_xticklabels([])
        axs[i].set_yticklabels([])

def plot_all_emotions():
    fig, axs = plt.subplots(1, 7, figsize=(30, 12))
    fig.subplots_adjust(hspace = .2, wspace=.2)
    axs = axs.ravel()
    for i in range(7):
        idx = data[data['emotion']==i].index[i]
        axs[i].imshow(train_images[idx][:,:,0], cmap='gray')
        axs[i].set_title(emotions[train_labels[idx].argmax()])
        axs[i].set_xticklabels([])
        axs[i].set_yticklabels([])

def plot_image_and_emotion(test_image_array, test_image_label, pred_test_labels, image_number):
    """ Function to plot the image and compare the prediction results with the label """

    fig, axs = plt.subplots(1, 2, figsize=(12, 6), sharey=False)

    bar_label = emotions.values()

    axs[0].imshow(test_image_array[image_number], 'gray')
    axs[0].set_title(emotions[test_image_label[image_number]])

    axs[1].bar(bar_label, pred_test_labels[image_number], color='orange', alpha=0.7)
    axs[1].grid()

    plt.show()

def plot_compare_distributions(array1, array2, title1='', title2=''):
    df_array1 = pd.DataFrame()
    df_array2 = pd.DataFrame()
    df_array1['emotion'] = array1.argmax(axis=1)
    df_array2['emotion'] = array2.argmax(axis=1)

    fig, axs = plt.subplots(1, 2, figsize=(12, 6), sharey=False)
    x = emotions.values()

    y = df_array1['emotion'].value_counts()
    keys_missed = list(set(emotions.keys()).difference(set(y.keys())))
    for key_missed in keys_missed:
        y[key_missed] = 0
    axs[0].bar(x, y.sort_index(), color='orange')
    axs[0].set_title(title1)
    axs[0].grid()

    y = df_array2['emotion'].value_counts()
    keys_missed = list(set(emotions.keys()).difference(set(y.keys())))
    for key_missed in keys_missed:
        y[key_missed] = 0
    axs[1].bar(x, y.sort_index())
    axs[1].set_title(title2)
    axs[1].grid()

    plt.show()
Keep reading with a 7-day free trial
Subscribe to Onepagecode to keep reading this post and get 7 days of free access to the full post archives.