

Artificial Neural Networks (ANNs) in Stock Prediction
Artificial Neural Networks in Stock Market Forecasting: A Comprehensive Exploration

I've been working on improving the podcast and have created this new version. I’d love for you to listen and share your feedback—it will help me make the podcast even better! It is on youtube so it’s free for this time for everyone.
Stock market forecasting plays a critical role in financial decision-making and risk management. Accurate predictions of stock prices empower investors, businesses, and financial institutions to make informed choices that maximize profits and minimize losses. The stock market, however, is an intricate system characterized by its chaotic and dynamic nature, with prices influenced by a wide range of factors, such as macroeconomic trends, corporate policies, investor sentiment, and geopolitical events. These complexities make forecasting an immensely challenging yet highly rewarding endeavor.
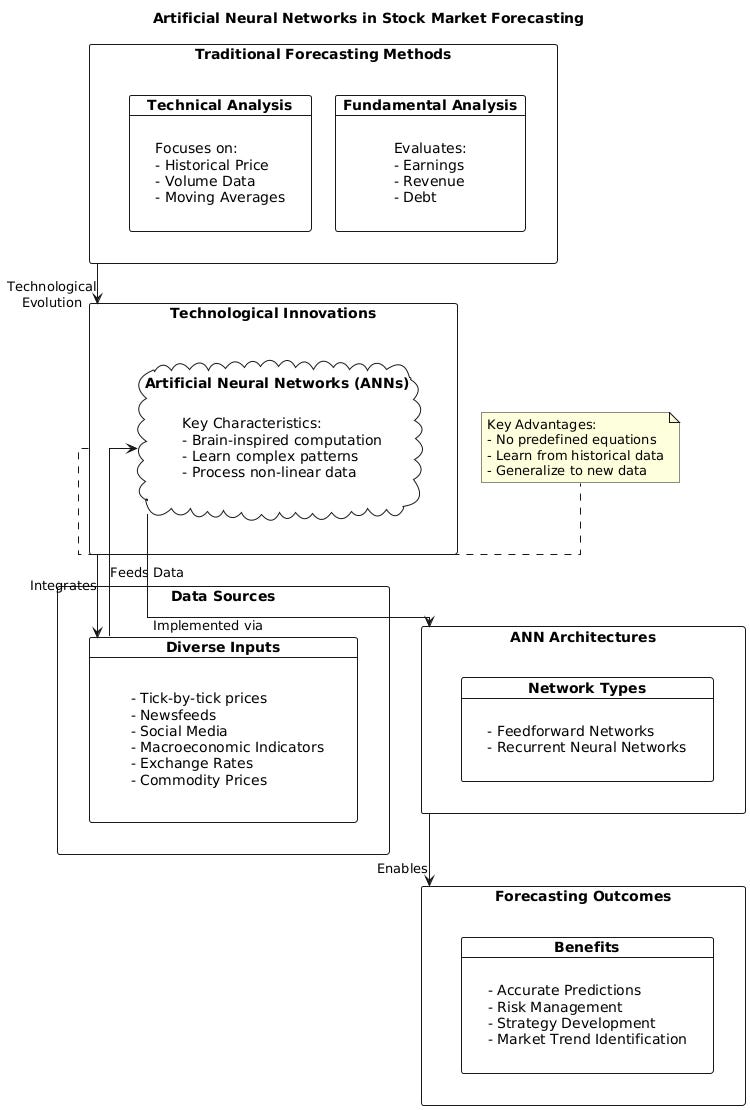
Traditionally, stock market forecasting relied heavily on fundamental and technical analyses. Fundamental analysis evaluates a company’s financial health by examining metrics like earnings, revenue, and debt. This method is rooted in the belief that understanding the intrinsic value of a company can guide investment decisions. On the other hand, technical analysis focuses on historical price and volume data to identify patterns and trends, often using tools like moving averages and oscillators. While both approaches have proven valuable, they also exhibit limitations, particularly in adapting to the ever-evolving nature of financial markets and the influx of data in modern times.
The emergence of technology has revolutionized stock market analysis, addressing some of these traditional limitations. Advancements in data processing, computational power, and machine learning algorithms have opened new possibilities for analyzing and predicting stock prices. Among these technological innovations, artificial neural networks (ANNs) have emerged as a groundbreaking tool. Inspired by the structure and function of the human brain, ANNs are computational systems capable of learning complex patterns and relationships from data. Their adaptability and ability to process non-linear, noisy, and multi-dimensional datasets make them particularly suited for tackling the intricacies of stock market forecasting.
Unlike traditional statistical methods, ANNs do not rely on predefined equations or assumptions about data distributions. Instead, they learn from historical data to approximate functions and relationships that may not be immediately evident. This capability allows ANNs to uncover hidden patterns in financial datasets, enabling them to make accurate predictions even in the face of market volatility and noise. Their strength lies in their ability to generalize; once trained, ANNs can apply learned knowledge to new, unseen data, making them a powerful tool for forecasting future stock prices.
The use of ANNs in stock market forecasting marks a significant shift in methodology, bridging the gap between traditional analysis and cutting-edge computational techniques. As financial markets generate ever-increasing volumes of data, including tick-by-tick price updates, newsfeeds, and social media sentiment, ANNs are well-equipped to process and analyze this information. Advanced ANN architectures, such as feedforward networks and recurrent neural networks, have further enhanced the ability to predict stock prices by considering both historical trends and sequential dependencies in data.
Moreover, ANNs’ flexibility allows them to integrate data from diverse sources, including macroeconomic indicators, exchange rates, and commodity prices. By combining these inputs, ANNs offer a holistic view of market conditions, enabling more accurate predictions. This adaptability also positions ANNs as a key technology for the future of financial analysis, as they can be continually improved and optimized to account for new data and evolving market dynamics.
In addition to their predictive power, ANNs contribute to risk management by identifying potential market trends and anomalies. Financial institutions and individual investors can use ANN-driven models to develop strategies that hedge against unfavorable market movements or capitalize on emerging opportunities. As a result, ANNs are not only transforming the way stock prices are forecasted but also reshaping the broader landscape of financial strategy and decision-making.
The Stock Market Forecasting Landscape
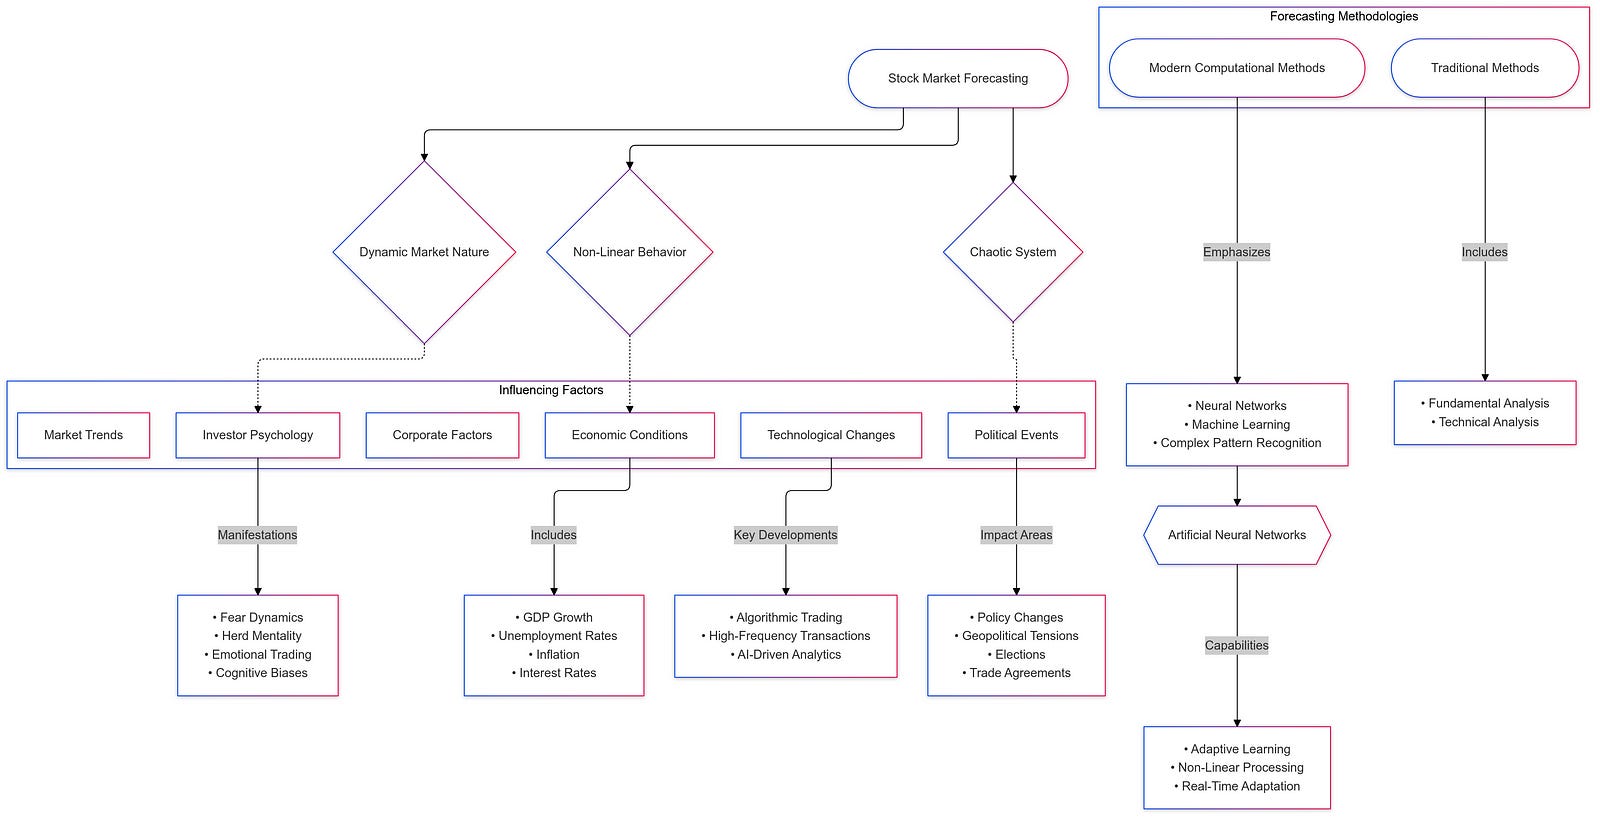
Predicting stock prices is an inherently complex task due to the dynamic, non-linear, and chaotic nature of financial markets. Stock prices are influenced by an intricate web of interdependent factors, making their movements highly unpredictable. Unlike many systems where changes follow clear patterns, the stock market operates in a constantly shifting environment where even minor events can lead to significant fluctuations. These characteristics present unique challenges for forecasting, demanding methods capable of handling uncertainty, noise, and abrupt changes.
One of the key challenges in predicting stock prices lies in their non-linear behavior. The relationship between market inputs, such as economic indicators or corporate earnings, and stock prices is rarely straightforward. Traditional linear models often struggle to capture these complexities, resulting in oversimplified predictions. Non-linearity in the stock market arises from the interaction of numerous factors, including the actions of millions of investors, each with unique motivations and strategies. These interactions create feedback loops that amplify trends or dampen them unpredictably.
Adding to this complexity is the dynamic nature of the stock market. Prices are influenced not only by historical data but also by real-time developments. The rapid pace of trading, driven by technological advancements like algorithmic trading, further exacerbates this dynamism. Prices can shift in milliseconds based on new information, such as a company’s quarterly earnings report or a geopolitical event. This makes it essential for forecasting models to adapt quickly and process information as it becomes available.
The chaotic behavior of stock markets is another formidable challenge. Chaotic systems are sensitive to initial conditions, meaning small differences in input data can lead to vastly different outcomes. This sensitivity, often referred to as the “butterfly effect,” is particularly evident in stock markets where investor sentiment, rumors, and psychological biases can disproportionately impact prices. For example, panic selling triggered by a rumor, even if unsubstantiated, can create market volatility, further complicating predictions.
Several external and internal factors influence stock market movements, contributing to their unpredictability:
Economic Conditions:
Macroeconomic indicators such as GDP growth, unemployment rates, inflation, and interest rates play a significant role in shaping investor expectations.
For instance, a rise in interest rates may lead to reduced borrowing and slower economic growth, potentially lowering stock prices. Conversely, positive economic data can boost investor confidence and drive market growth.
Investor Psychology:
Human behavior and psychological factors like fear, greed, and herd mentality significantly impact market trends.
Investors often react irrationally to news, exaggerating price movements and creating volatility. Behavioral biases, such as overconfidence or loss aversion, further complicate forecasting efforts.
Political Events:
Government policies, elections, trade agreements, and geopolitical tensions are major drivers of market sentiment.
Events such as changes in tax policies, sanctions, or military conflicts can have immediate and far-reaching impacts on stock prices. For instance, uncertainty during elections often leads to market volatility as investors attempt to predict policy outcomes.
External Market Trends:
Global interconnectedness means that events in one market can ripple across others. Movements in international stock markets, commodity prices, or exchange rates often influence domestic stock performance.
For example, a decline in oil prices might benefit oil-importing nations but negatively affect energy-exporting countries, creating contrasting market trends.
Corporate-Specific Factors:
Company-specific events, such as earnings announcements, product launches, mergers, or scandals, directly impact stock prices.
Investors closely monitor these developments, which can lead to sudden and substantial price changes.
Technological and Structural Changes:
The rise of algorithmic trading and high-frequency trading has introduced additional layers of complexity.
Automated systems react to market signals faster than humans, often creating short-term volatility that is challenging to predict.
Given these factors, traditional methods like fundamental and technical analysis have struggled to fully address the complexities of stock price forecasting. While fundamental analysis provides valuable insights into a company’s intrinsic value, it often falls short in accounting for real-time market dynamics. Similarly, technical analysis, which relies on historical price patterns, can be disrupted by unprecedented events or shifts in market sentiment.
Modern computational methods, particularly those leveraging artificial neural networks (ANNs), have emerged as powerful tools to navigate this challenging landscape. By analyzing large volumes of data and identifying hidden patterns, ANNs can offer a nuanced understanding of market dynamics. Their ability to process non-linear relationships and adapt to changing conditions makes them well-suited for the unpredictable nature of stock markets.
Traditional and Modern Prediction Techniques
Forecasting stock market movements has evolved significantly over the years, with traditional methods giving way to more sophisticated computational techniques. Both approaches play a vital role in analyzing the complex dynamics of stock markets, each with its unique strengths and limitations.
Traditional Methods
The two primary traditional techniques for predicting stock market trends are fundamental analysis and technical analysis. These methods have been the cornerstone of investment strategies for decades.
1. Fundamental Analysis
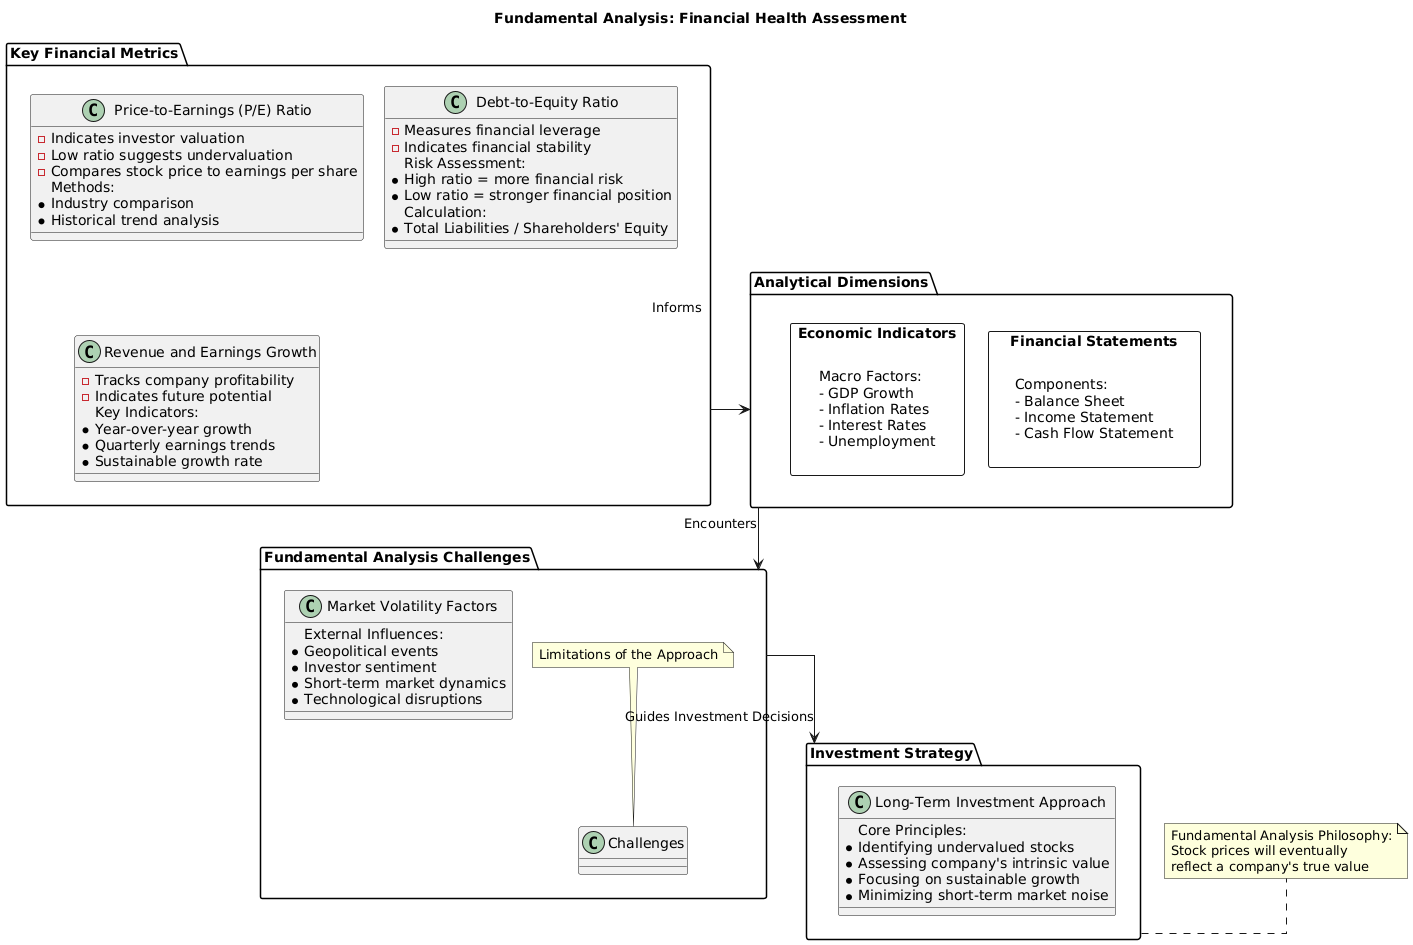
Fundamental analysis focuses on assessing a company’s financial health and intrinsic value. By examining financial statements, earnings reports, and economic indicators, this method aims to determine whether a stock is undervalued or overvalued. The goal is to identify long-term investment opportunities based on the strength of a company’s operations and its potential for growth.
Metrics commonly used in fundamental analysis include:
Price-to-Earnings (P/E) Ratio: Indicates how much investors are willing to pay per dollar of earnings. A low P/E ratio may suggest that a stock is undervalued.
Debt-to-Equity Ratio: Measures a company’s financial leverage and stability.
Revenue and Earnings Growth: Highlights a company’s profitability and potential to generate returns.
Fundamental analysis assumes that a company’s stock price will eventually align with its intrinsic value. While this method provides deep insights into a company’s financial position, it often falls short in addressing short-term market volatility and external factors like geopolitical events or investor sentiment.
2. Technical Analysis
Unlike fundamental analysis, technical analysis focuses exclusively on historical market data, such as stock prices, trading volume, and trends. The underlying premise is that market prices reflect all available information, and studying past patterns can help predict future movements.
Technical analysts rely on tools like:
Moving Averages: Smooth out price data to identify trends over time.
Relative Strength Index (RSI): Measures the speed and change of price movements to identify overbought or oversold conditions.
Candlestick Charts: Provide visual representations of price movements over specific periods.
Time-series analysis is often employed in technical analysis to model and forecast stock prices based on historical data. By identifying recurring patterns or cycles, analysts aim to make informed predictions about future price behavior.
