

Code By Code: Forecasting Stock With Deep Learning
Today I am going to show you step by step how you can forecasting any stock, in our case boeing stock using deep learning.

Let’s start coding:
The first step would be creating the mydatabse in mongoDB and loading the json api file which is unstructred data into database and transforming into structured data to use it for postgreSQL.
#Importing necessary packages of mongoDB
import pymongo
import json
import os
from bson.objectid import ObjectId
from bson.raw_bson import RawBSONDocument
import pandas as pd
pd.options.display.max_rows = None
This code loads essential MongoDB tools like pymongo, json, os, and bson, with specific bson functions like ObjectId and RawBSONDocument. It also pulls in the pd module from pandas and sets it to show all rows. The code sets up whats needed to use MongoDB and show data in a pandas DataFrame.
import os
os.getcwd()
The code imports the os library to work with the operating system. It then uses the getcwd function from the os module to get the path of the current working directory. This helps the codemer find out where the code is running and manage files and folders in that directory.
#Connect to database
connection = pymongo.MongoClient('mongodb://localhost:27017/')
#Create Database
database = connection['mydatabase_Boeing']
#Create Colletcion
collection = database['mycollection_Boeing']
#Loading data into the Database
with open(r'C:/Users/Gollamudi/Desktop/karsar/BA.json', 'r') as sa:
    Boeing_data = json.load(sa)
collection.insert_one(Boeing_data)
The code uses pymongo to connect to MongoDB with a URL, creates mydatabase_Boeing and a mycollection_Boeing inside it. It loads data from a JSON file and adds it to the collection using insert_one. Simply, it connects to MongoDB and adds JSON file data to it.
#Verifying whether the data loaded correctly
for s in collection.find({'dataset': 'data'}):
    test_s = pd.DataFrame(s)
    test_s
The code test_s.dropcolumns=_id removes the _id column from the test_s DataFrame, which was created after confirming the correct loading of a dataset named data. This step prepares the data for easier analysis by cleaning it up.
#connecting to database
client = pymongo.MongoClient()
#point the client at mongo
mng_client = pymongo.MongoClient('mongodb://localhost:27017/')
#select the Database
db = client['mydatabase_Boeing']
#select the collection within the database
test = db.mycollection_Boeing
This code uses pymongo to connect to a client database, access mydatabase_Boeing on the local server at port 27017, and interact with a collection called mycollection_Boeing through a variable named test. It sets up the connection for data operations in Python.
#Displaying the unstructured data which was loaded into mongoDB
list(test.find())[0]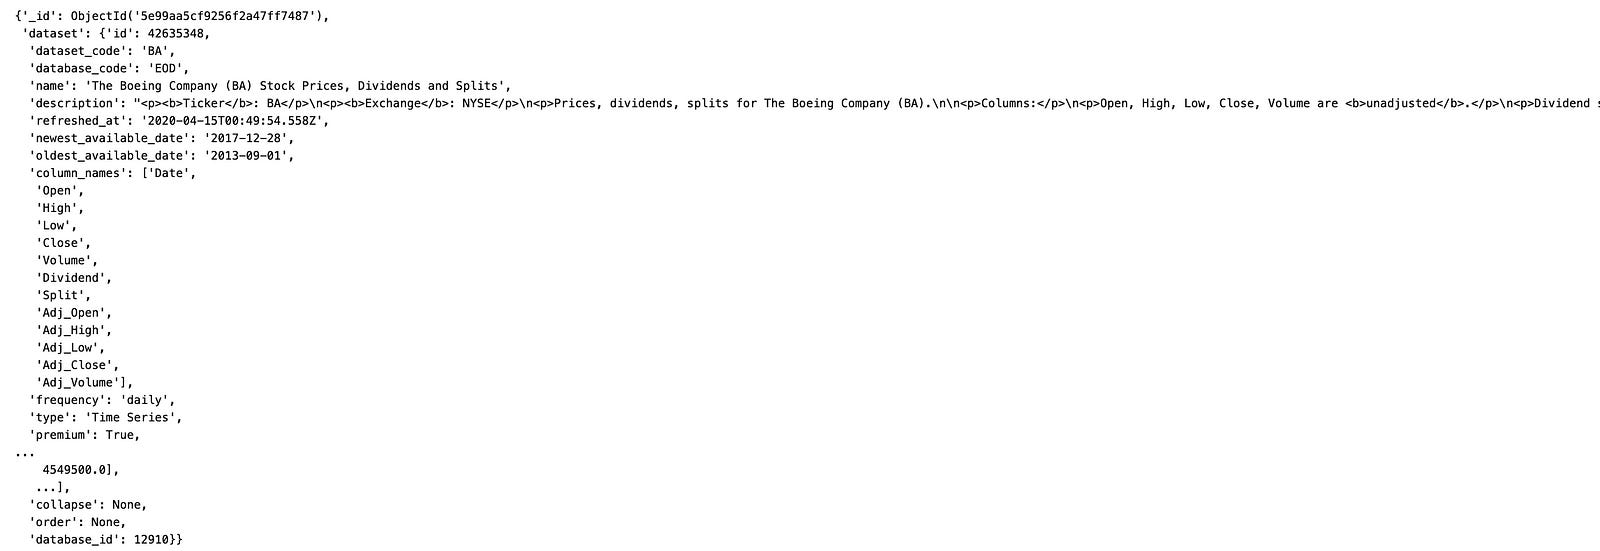
This code gets data from MongoDB and puts it in a list. It uses find to get all items in a collection, and list to turn them into a list. Then, it shows the first item on the screen with [0]. This lets us see and use the data from MongoDB.
#Converting the unstructured data into structured data to load into the postgreSQL
test
colnames = list(test.find())[0]['dataset']['column_names']
data = list(test.find())[0]['dataset']['data']
This code transforms messy data into an organized format for easy entry into a postgreSQL database. It starts by turning the results of a find function, which gets data from a test collection, into a list. It picks the first item in that list, which holds the data we need. Then, we grab a list of column names and save it to colnames. We also get the rows of data, save them as data, and now this information is ready to be imported into the database for more actions or study.
#Loading into the dataframe
df = pd.DataFrame(data, columns=colnames)
df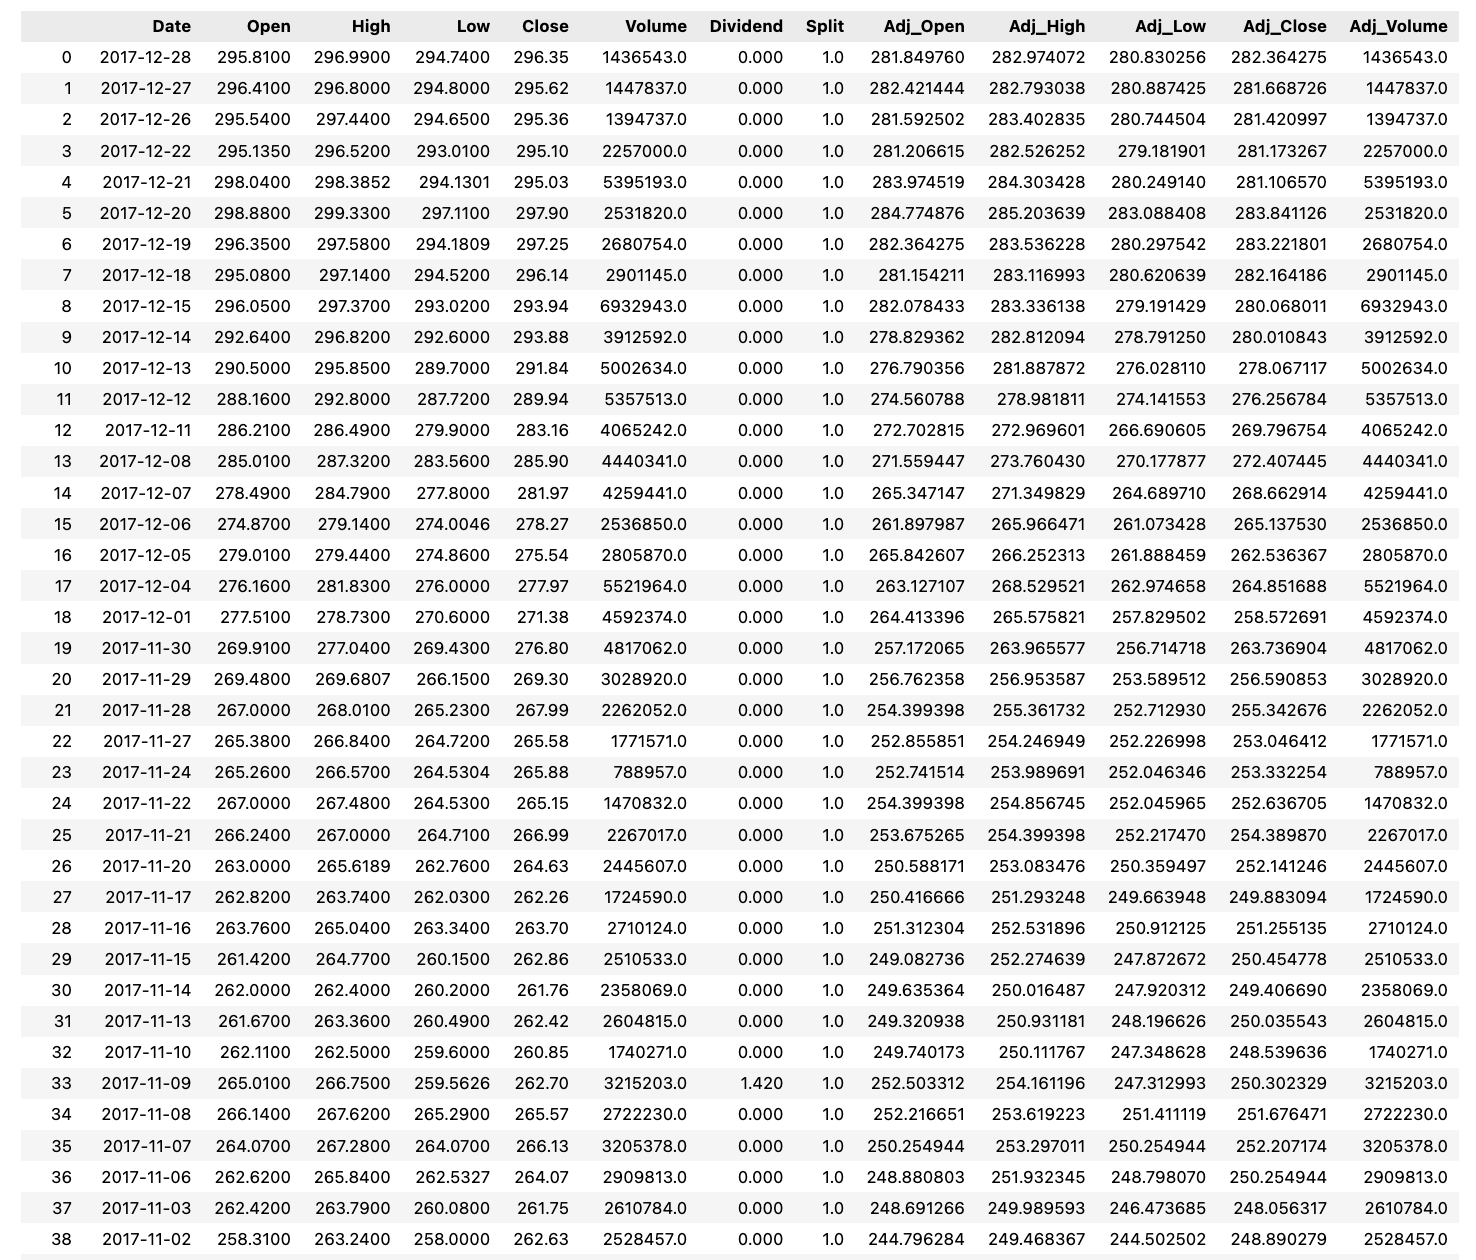
This code uses pandas to make a new dataframe df with data split into columns named by colnames, and then returns df.
#Visualising the missing values#
import missingno as msno
msno.matrix(df)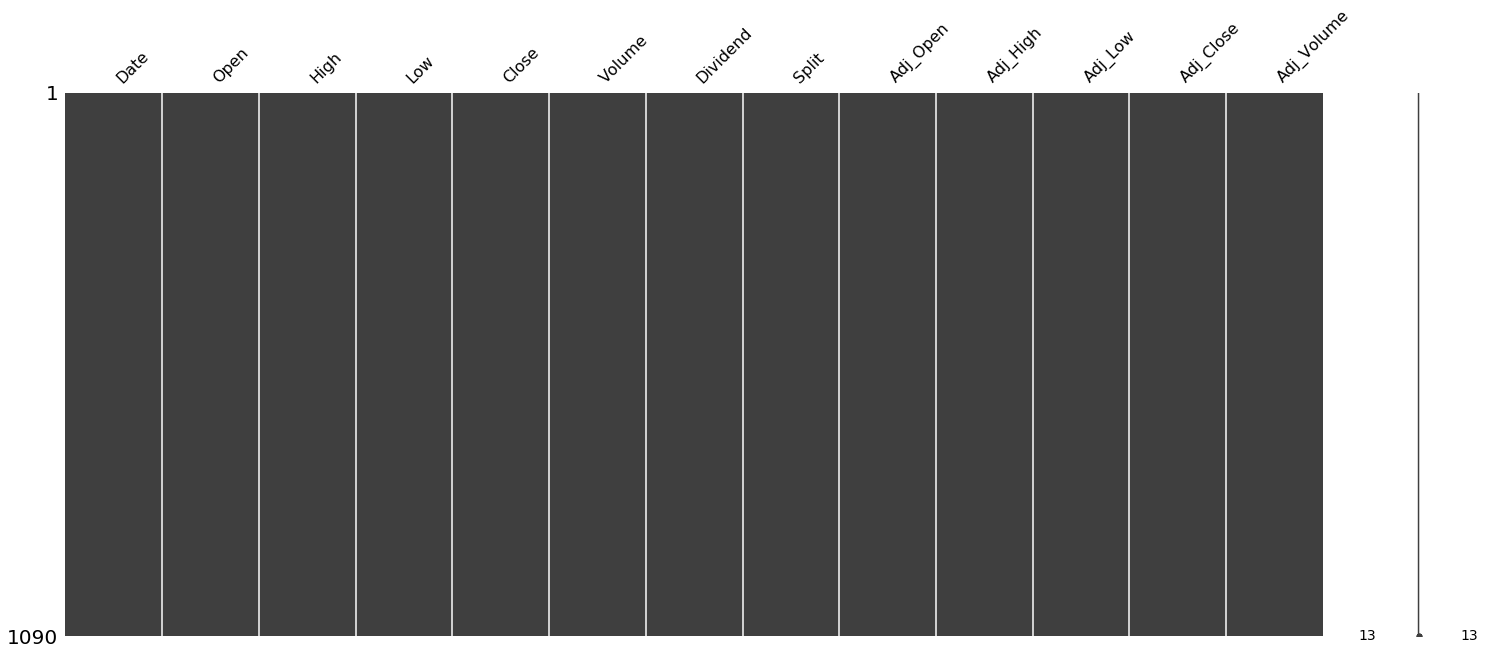
This code helps to quickly spot missing data in a dataset. It starts by importing the missingno library which has tools for showing where data is missing. Then, it uses the msno.matrix function to make a plot that highlights the missing spots in the df dataset. This makes it easier to clean and analyze the data.
