

Cracking the Market Code: Predicting Stocks in a Dynamic World
Uncovering Real-Time Correlations and Hidden Patterns to Revolutionize Stock Forecasting

Source code link at the end!
Stock price prediction is one of the most challenging problems in finance. The market behaves like a complex, interconnected system, where prices are influenced by a variety of unpredictable factors. Economic trends, breaking news, investor sentiment, and global events all create sudden and volatile movements in stock prices. This mix of influences makes the market dynamic and highly reactive, defying simple or linear predictions.
Traditional forecasting methods struggle to handle this complexity. Many rely on predefined rules or static assumptions, such as grouping stocks based on industry or historical relationships. However, the real stock market is far from static. Stocks that typically move together can suddenly behave oppositely due to a change in investor perception, unexpected news, or shifts in market conditions. Moreover, stock correlations often occur at specific moments and across different time steps. For example, one stock may react instantly to market news, while another responds with a delay, creating a time-offset correlation.
These limitations highlight a critical challenge: how can we accurately predict stock movements in a market that is constantly changing and inherently interconnected? To achieve this, it is essential to identify and model real-time, momentary correlations between stocks and adapt predictions to the ever-changing market environment. By doing so, forecasting becomes more dynamic, capturing not just historical trends but the hidden patterns driving stock prices today.
The Motivation: Why Existing Methods Fall Short
Predicting stock prices has long been a cornerstone of financial decision-making. Despite technological progress, many conventional methods still fail to deliver accurate and reliable forecasts. The core issue lies in their inability to adapt to the market’s dynamic nature and uncover real-time, hidden relationships between stocks. This shortcoming stems from three major flaws: reliance on static stock relationships, a lack of real-time flexibility, and the burden of manual feature selection.
Static Stock Relationships
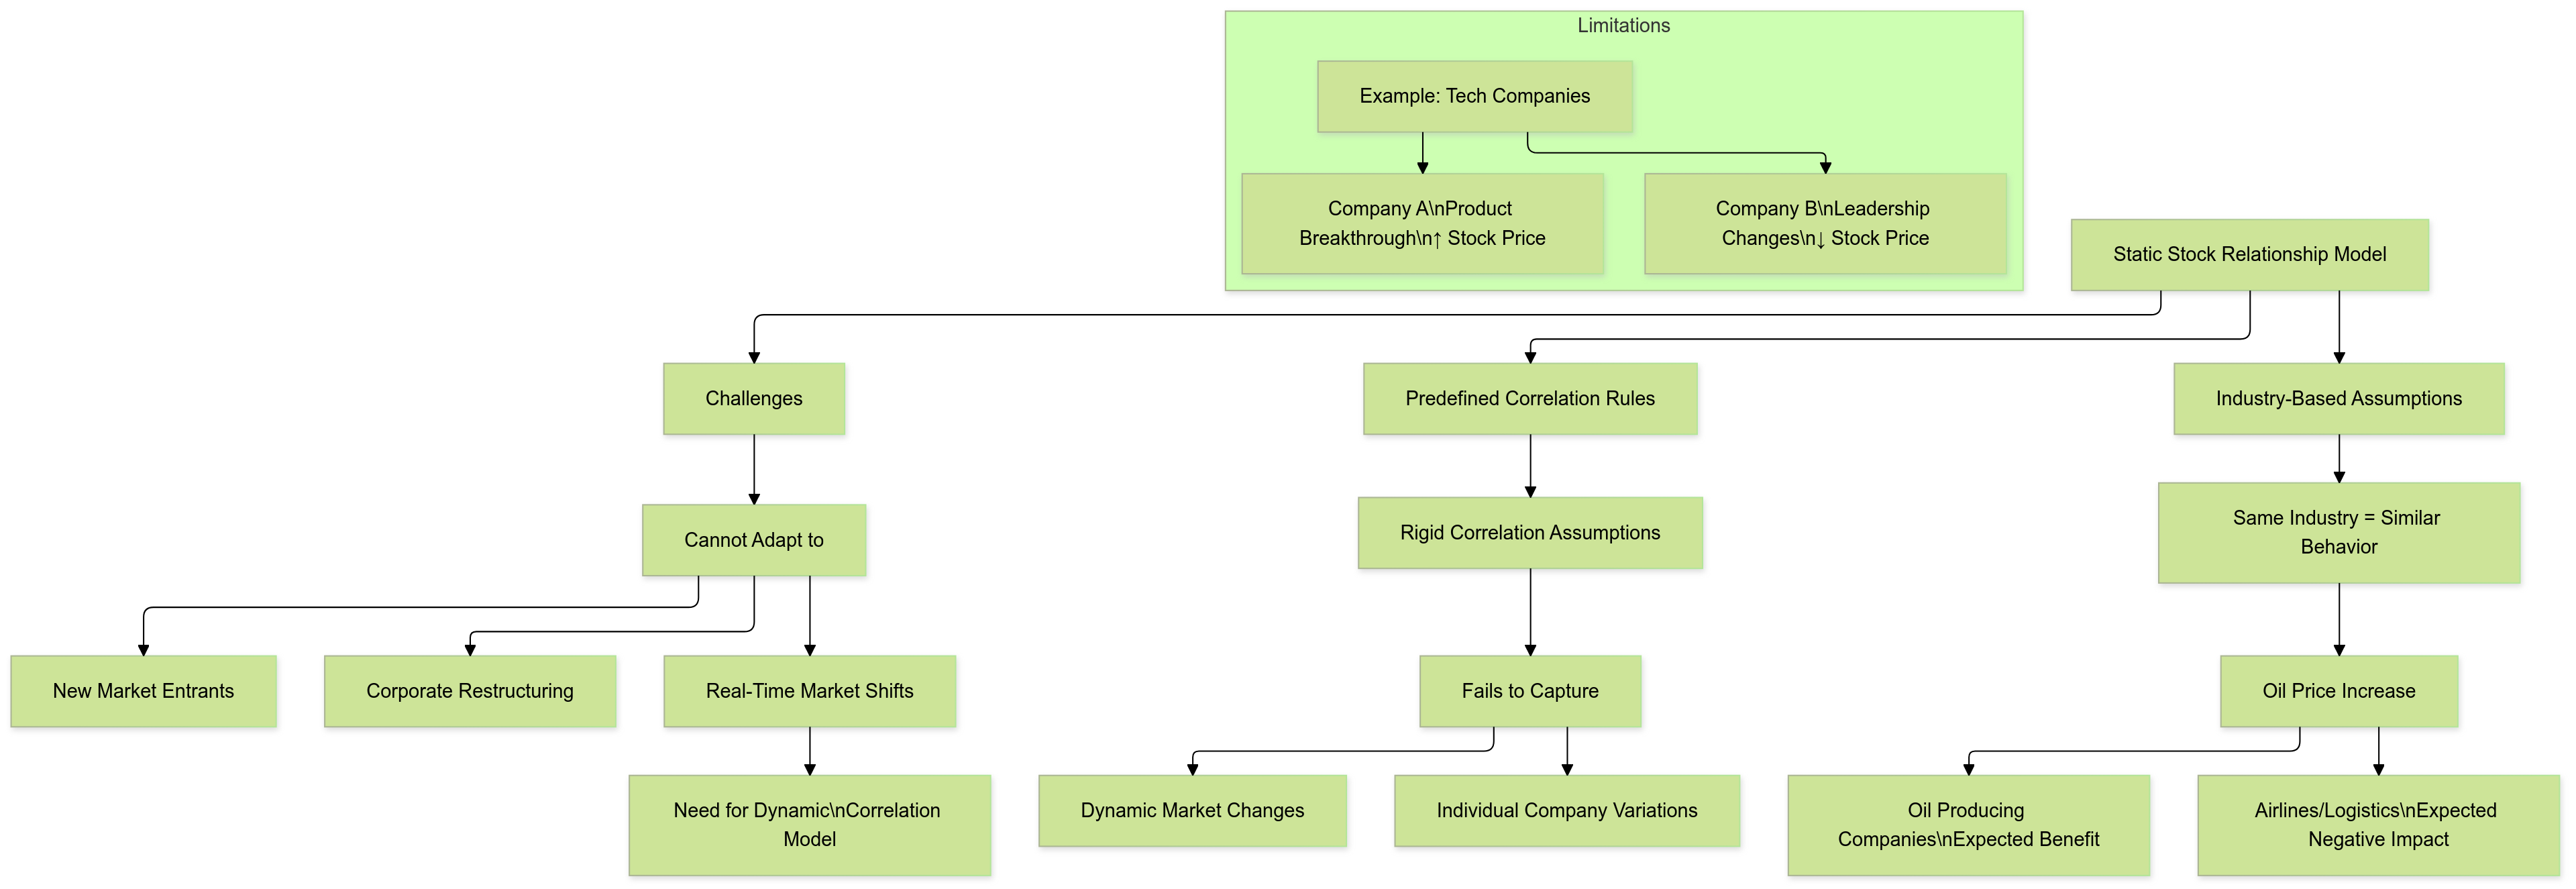
Traditional stock prediction methods often rely on static rules to define relationships between stocks. For example, stocks in the same industry are assumed to behave similarly because they are exposed to similar market forces. If oil prices rise, oil-producing companies are expected to benefit, while airlines or logistics firms might suffer due to increased operational costs. While this approach seems logical, it oversimplifies the complexities of real-world stock behavior.
In reality, even stocks within the same industry can react differently to the same event. Take two technology companies: one might see a price surge due to a breakthrough product, while another could experience a decline due to leadership changes or supply chain disruptions. Static rules fail to account for such situations because they assume consistent, long-term correlations between stocks. This rigid approach cannot capture the highly dynamic, momentary relationships that often define stock behavior in today’s markets.
Moreover, static relationships struggle to accommodate new stocks or industries entering the market. For instance, a company’s IPO (initial public offering) or a major corporate restructuring can significantly alter its correlation with other stocks. Static assumptions often overlook such changes, leading to outdated and inaccurate predictions. A more flexible approach is needed — one that identifies stock correlations dynamically, reflecting real-time market behaviors rather than predefined, fixed rules.
Lack of Real-Time Flexibility
Most conventional models summarize stock movements over a long historical period to produce forecasts. While this may work for identifying broad trends, it often blurs critical time-specific details that drive real-world market movements. Stocks do not always behave uniformly across time. Their correlations can be short-lived, highly volatile, and often influenced by events at specific moments. Ignoring these momentary and time-offset interactions leads to incomplete and less accurate forecasts.
For example, consider the relationship between upstream and downstream companies in a supply chain. An upstream manufacturer of raw materials might react immediately to news of a resource shortage, while a downstream consumer of those materials (e.g., a retailer) may respond days later. This creates a time-offset correlation — a lagged relationship that conventional models fail to capture because they analyze data in a temporally aligned manner.
Furthermore, markets are highly sensitive to external shocks like economic policy changes, natural disasters, or global events. Stock correlations can shift unpredictably in response to such factors. A news report might trigger an immediate sell-off in one sector while leaving another unaffected. Static models, which average correlations over time, cannot adapt quickly to these short-term changes. This lack of flexibility makes it impossible to capture the real-time relationships that drive stock prices.
The need, therefore, is for a model that works at a more granular level — one that can detect and leverage momentary relationships as they happen, across different time steps and stocks.
Manual Feature Selection
In traditional stock forecasting, feature selection plays a critical role. Analysts often rely on manually chosen features — such as moving averages, price-to-earnings ratios, or trading volumes — to predict future price movements. While these features may be effective in some market conditions, their relevance tends to change over time as market dynamics evolve.
For example, in a bull market (rising stock prices), features like trading volume might carry greater significance due to increased investor participation. However, in a bear market (declining prices), factors like company fundamentals or volatility indices might become more influential. Manually choosing and tuning features for different scenarios is a labor-intensive process that requires deep expertise and constant re-evaluation. This approach is neither scalable nor adaptable to fast-moving financial markets.
Even worse, relying on static features introduces bias and increases the risk of using outdated or ineffective indicators. For instance, a feature that worked well during a period of low volatility may become irrelevant during a financial crisis. The inability to adapt to evolving market conditions often leads to poor performance and missed opportunities.
What’s needed is an automated system that can dynamically select the most effective features based on real-time market conditions. By removing human bias and guesswork, such a system would ensure that the most relevant factors are always prioritized.

The Solution: A Smarter, Dynamic Model
The shortcomings of conventional models — static assumptions, a lack of real-time flexibility, and manual feature selection — highlight the need for a smarter, more dynamic solution. The ideal approach should achieve the following:
Capture Real-Time Correlations: The model should identify relationships between stocks as they occur, focusing on momentary and time-offset patterns rather than static, predefined rules.
Adapt to Market Dynamics: By analyzing market behavior in real time, the model should adjust its predictions based on current conditions, ensuring it remains effective across different scenarios.
Automate Feature Selection: Instead of relying on manually chosen indicators, the model should automatically determine which features are most relevant at any given moment based on the market’s status.
Such a model would act as a real-time observer of the market, constantly learning and adjusting to uncover hidden patterns that traditional methods fail to detect. It would not only predict stock price movements more accurately but also provide a deeper understanding of the complex relationships that drive the market.
In essence, the solution lies in building a dynamic, market-aware system that brings together real-time insights, intelligent feature selection, and a flexible architecture capable of modeling intricate stock correlations. By addressing the flaws of older methods, this approach has the potential to revolutionize how stock forecasting is done, offering investors a sharper, more reliable tool to navigate today’s ever-changing financial markets.
The Idea: Unveiling Hidden Market Patterns
Accurately predicting stock prices requires more than analyzing historical trends; it demands uncovering the complex and ever-changing relationships between stocks. The stock market operates like a living network, where stocks interact in real time, influenced by a web of factors such as supply chains, economic signals, and market sentiment. These interactions are often fleeting, occurring at specific moments or with time delays, making them hard to capture using conventional methods.
The core idea revolves around two critical concepts: momentary and cross-time correlations and market-guided feature selection. Together, they provide a clearer, more dynamic picture of how stocks behave, enabling more accurate predictions and deeper insights into market movements.
Momentary and Cross-Time Correlations
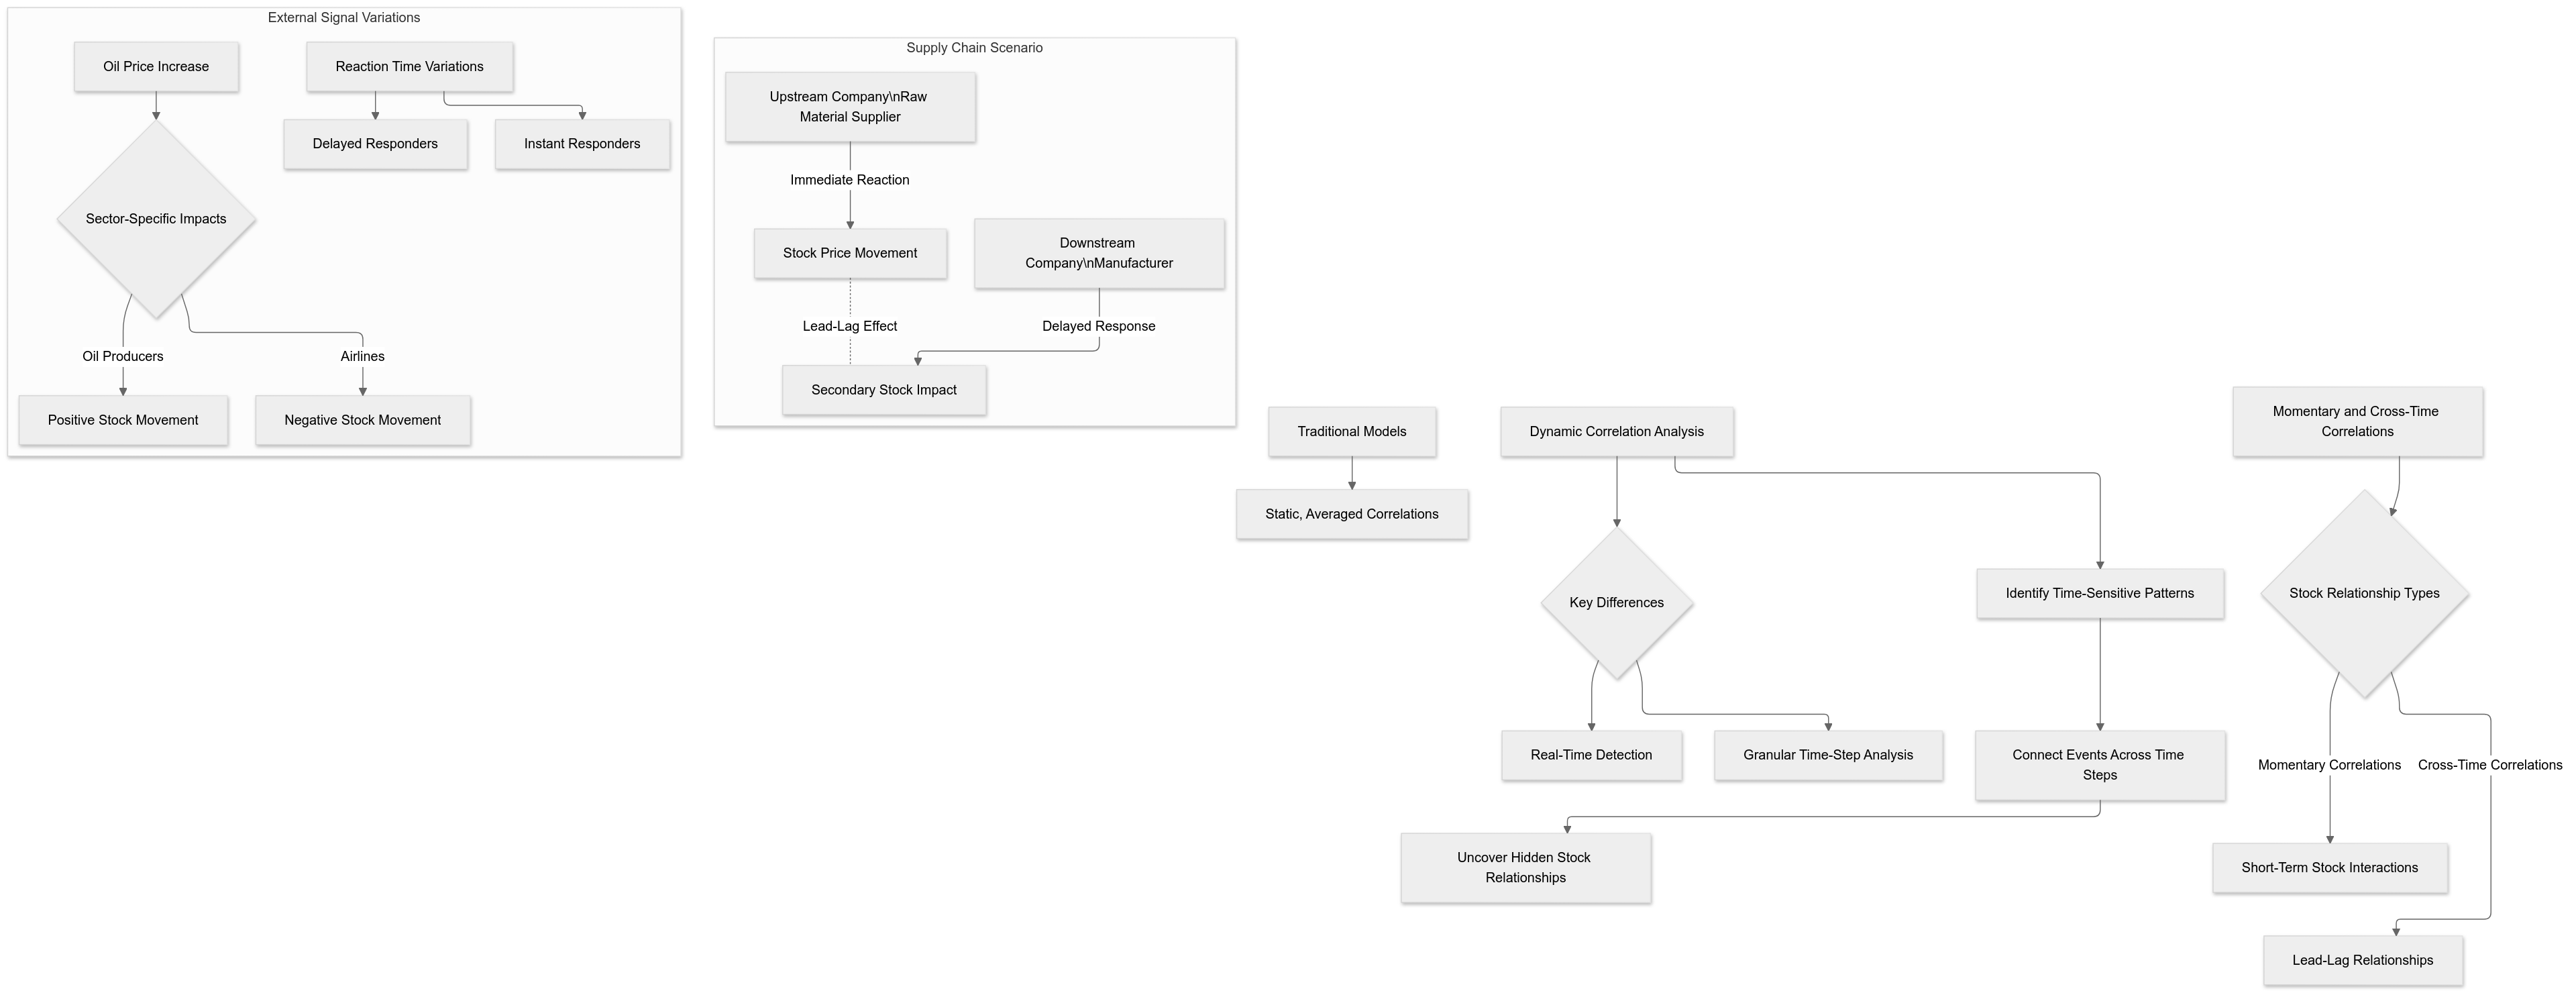
In a real-world stock market, relationships between stocks are rarely static or consistent. Traditional models assume that if two stocks are related, they will behave similarly across the entire historical period. However, this is far from true. Stock correlations are often momentary, occurring for short periods, and may also be cross-time, meaning one stock’s behavior influences another at a later time.
Consider the example of a supply chain relationship:
An upstream company (e.g., a raw material supplier) may respond immediately to news about a shortage of resources. The stock price for this company might rise or fall based on the perceived impact of the event.
A downstream company (e.g., a manufacturer relying on those raw materials) may react more slowly, only showing significant price movements after the effects of the shortage ripple through the market.
This delay creates what is known as a lead-lag effect, where one stock’s movement leads the other. Capturing such cross-time relationships is critical for making accurate predictions. For instance, identifying that an upstream supplier’s price has moved sharply could help forecast movements in downstream companies before they occur.
Stocks also respond differently to the same external signals. For example:
A sudden increase in oil prices might immediately affect oil producers positively but negatively impact airlines due to higher operational costs.
The reaction time for companies within the same sector can vary. Some may respond instantly to the news, while others might delay their reaction until analysts provide further clarity.
By analyzing momentary and cross-time correlations, the model identifies these time-sensitive patterns. Instead of averaging out relationships over an entire historical window, it dynamically detects when and where correlations are strongest. This approach allows the model to connect events and stock movements across different time steps, capturing hidden relationships that traditional methods often miss.
Market-Guided Feature Selection
Another significant aspect of the idea is the use of real-time market information to automatically identify which features are most relevant at any given moment. In traditional forecasting, analysts rely on hand-picked features like moving averages, price-to-earnings ratios, or trading volumes. However, the effectiveness of these features changes as market conditions evolve.
For example:
In a bull market (where prices are rising), trading volumes may carry greater weight because of increased investor activity and optimism.
In a bear market (where prices are declining), indicators like volatility or company fundamentals may become more influential as investors focus on risk management.
Instead of manually selecting features, the model uses real-time market signals — such as market index trends, trading volumes, and volatility measures — to guide its feature selection dynamically. It achieves this through a gating mechanism, which adjusts the importance of different features based on the current market conditions.
Imagine the market is experiencing a sudden surge in volatility:
The model might emphasize volatility-related features (e.g., price fluctuations) while downplaying other less relevant indicators.
If the market stabilizes, it may shift focus to long-term trends like moving averages or price momentum.
By incorporating current market data, the model adapts to changing scenarios without requiring constant human intervention. This flexibility ensures that it always prioritizes the most relevant features, improving prediction accuracy across different market phases.
Bringing It Together: A Dynamic and Adaptive Approach
The combination of momentary and cross-time correlations with market-guided feature selection gives the model a powerful edge. It not only captures the relationships between stocks at specific moments but also adapts its analysis to reflect the market’s current state.
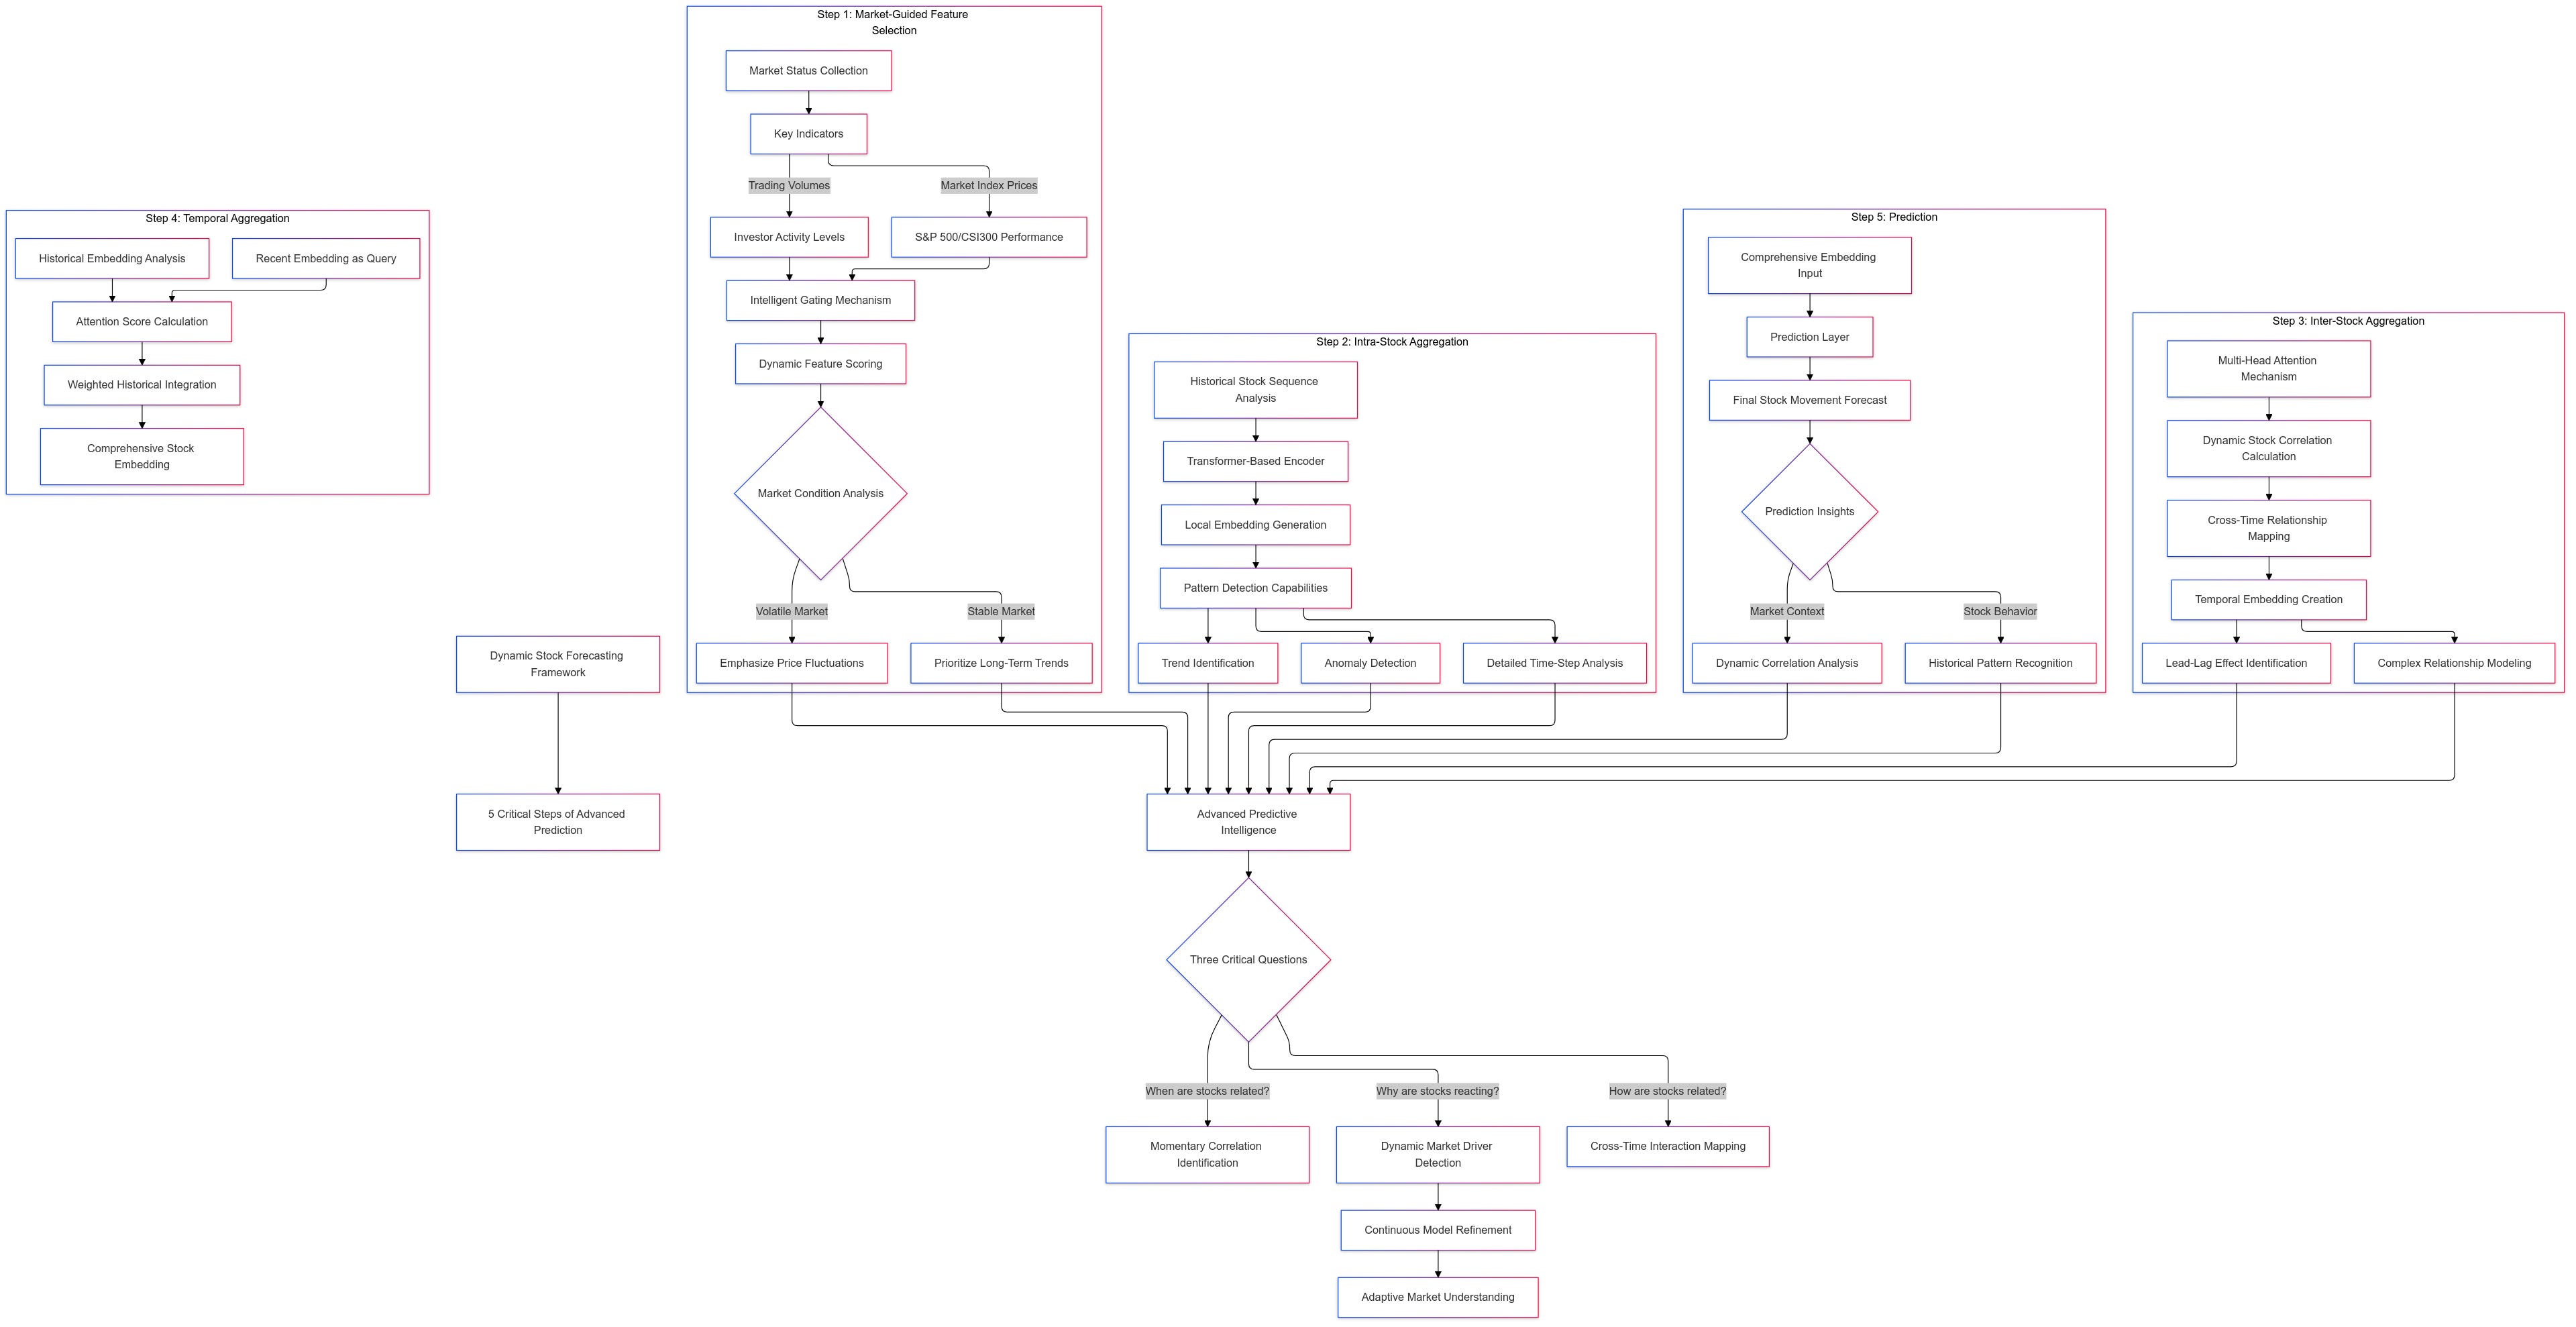
This approach answers three critical questions about stock behavior:
When are stocks related? — By identifying momentary correlations, the model pinpoints the specific time windows when relationships occur.
How are stocks related? — By capturing cross-time correlations, it maps out delayed interactions, such as the lead-lag effects seen in supply chains.
Why are certain stocks reacting? — By dynamically selecting features based on market conditions, the model identifies the underlying drivers influencing stock movements.
For example, during a period of economic uncertainty, the model might detect that defensive sectors (e.g., utilities or healthcare) show stronger correlations as investors seek safer options. Alternatively, in a bull market, it might identify that growth stocks are more closely linked as investor confidence drives riskier investments.
How It Works: Breaking Down the Framework
The framework is designed to analyze stock movements dynamically by identifying hidden patterns both within individual stocks and between different stocks across time. It uses a multi-step process to capture these relationships, adapt to changing market conditions, and produce accurate predictions. Let’s break down how it works step by step.
Step 1: Market-Guided Feature Selection
At the heart of this step is the ability to adapt to the current state of the market. Instead of relying on manually chosen features like moving averages, trading volumes, or volatility metrics, the model automatically selects the most relevant features based on real-time market conditions.
Here’s how it works:
The model collects market status information, such as market index prices and trading volumes, which are key indicators of the market’s overall behavior.
The market index price reflects the performance of a group of top companies (e.g., S&P 500, CSI300). It provides insights into whether the market is trending upward (bull market), downward (bear market), or remaining volatile.
The market trading volume shows how actively investors are buying or selling. High trading volume often signals increased investor interest and market activity.
Using this information, a gating mechanism analyzes and scores each feature (e.g., moving averages, price volatility, momentum). The gating mechanism acts as a filter, emphasizing features that are most effective for the current market phase and reducing the importance of irrelevant ones.
For example, if the market is highly volatile, features like price fluctuations and volatility measures will be emphasized.
In a stable market, long-term trends such as moving averages may carry more weight.
The gating mechanism automatically adjusts feature importance using a process learned during training. It eliminates the need for human intervention and avoids bias, ensuring that the model always focuses on the most meaningful features.
This dynamic feature selection not only improves accuracy but also makes the model highly adaptive, capable of handling different market conditions without manual tuning.
Step 2: Intra-Stock Aggregation
Once the features are refined, the model focuses on each individual stock’s historical data to uncover internal patterns. The goal here is to analyze the stock’s past behavior and identify signals that may influence future performance.
Here’s how the process unfolds:
The model takes the historical sequence of each stock’s features (e.g., price movements, trading volumes) over a set lookback period. This lookback period might span a few days or weeks, depending on the application.
Using a transformer-based encoder, the model examines the entire historical sequence to find relevant patterns. It aggregates information across time while preserving important details at each time step.
For example, it can identify trends such as steady price increases, sudden spikes, or prolonged declines.
It can also detect anomalies, like unexpected outliers or sharp price movements that deviate from historical patterns.
This process produces a local embedding at each time step. The local embedding is essentially a refined representation of the stock’s behavior at that specific point in time, informed by its past movements.
By maintaining these local embeddings, the model preserves important details that other methods might blur. This step ensures that signals within a stock’s historical data are clear and meaningful.
Step 3: Inter-Stock Aggregation
While intra-stock aggregation focuses on individual stocks, this step analyzes relationships between different stocks. It uses an attention mechanism to identify which stocks are most correlated at any given time. Importantly, it considers cross-time correlations, meaning that one stock’s behavior can affect another stock at a later time.
Here’s how it works:
At each time step, the model gathers the local embeddings of all stocks. These embeddings represent each stock’s internal patterns up to that point in time.
Using a multi-head attention mechanism, the model calculates dynamic correlations between stocks.
The attention mechanism assigns weights to other stocks based on how relevant their behavior is to the target stock.
For example, if a downstream company’s stock price is influenced by an upstream supplier, the model identifies this relationship, even if the supplier’s movement occurred earlier.
The attention mechanism enables the model to look beyond simple, aligned relationships. It uncovers time-offset patterns, such as “lead-lag” effects, where one stock reacts earlier and another stock follows later.
The result is a temporal embedding for each stock at every time step. This embedding captures both the stock’s own behavior and its dynamic relationships with other stocks at that moment.
Step 4: Temporal Aggregation
After intra-stock and inter-stock aggregation, the model now has a series of temporal embeddings for each stock, corresponding to different time steps in the lookback period. However, to make a prediction, the model needs to consolidate this information into a single representation.
Here’s how the model performs temporal aggregation:
The model uses the most recent temporal embedding (at the final time step) as the query. This query acts as the focal point for analyzing the previous time steps.
It calculates attention scores between the current embedding and all earlier embeddings. The attention scores determine how much importance each historical time step holds for the prediction.
For example, if a sharp movement in a stock occurred three days ago, the model might assign it higher importance for predicting today’s behavior.
The model combines the historical embeddings, weighted by their attention scores, to create a final comprehensive embedding for each stock.
This final embedding is a refined representation that summarizes the stock’s internal patterns, its relationships with other stocks, and its behavior over time.
Step 5: Prediction
The final step is where all the processed information is used to predict the future movement of each stock.
The comprehensive embedding for each stock is passed through a prediction layer. This layer is typically a simple linear function that translates the embedding into a predicted return ratio or price change.
The prediction reflects the model’s understanding of:
The stock’s historical behavior (intra-stock patterns).
Its relationships with other stocks at different times (inter-stock correlations).
The current market conditions and the most relevant features.
The result is a forecast that is not only more accurate but also more insightful, as it accounts for both individual stock patterns and the broader market context.
Why It Works: Real-World Advantages
The success of this approach lies in its ability to address the limitations of traditional stock forecasting models by embracing the complexity and real-time nature of the market. Unlike older methods, which rely on static assumptions and predefined features, this model dynamically adapts to changing market conditions and identifies hidden patterns within and between stocks. Here are the key advantages that make this approach effective:
1. Captures Dynamic Relationships
Stock market relationships are not static; they evolve over time, often in short bursts or with time lags. Conventional models assume that correlations between stocks are uniform and consistent across time, but real-world stock behavior tells a different story. Relationships between stocks can be fleeting, influenced by specific events, news, or market trends that occur momentarily.
This approach overcomes that limitation by identifying momentary and cross-time correlations — relationships that occur at specific moments or time steps but may not persist. For example:
If a raw material supplier (Company A) reacts immediately to news of a resource shortage, its stock price may rise or fall instantly.
A downstream company (Company B), which relies on those materials, may react more slowly, with its price changing days later as the market adjusts to the news.
The model detects this lead-lag relationship by analyzing the time-offset patterns between the two stocks. By incorporating the delay, it can forecast Company B’s behavior more accurately, ensuring the prediction reflects the market’s actual dynamics.
Such precision is essential in markets where relationships are constantly shifting. It allows the model to focus on what matters right now, rather than relying on outdated or averaged correlations.
2. Automatic Feature Selection
Another key advantage is the model’s ability to automatically select the most relevant features based on the current market status. Traditional methods require human analysts to choose features like moving averages, price momentum, or trading volumes. While these features can be useful, their effectiveness changes depending on market conditions. For example:
In a volatile market, features like price fluctuations and trading volumes may carry greater significance.
In a stable market, long-term trends such as moving averages might be more reliable indicators.
The model eliminates the need for manual feature selection by analyzing real-time market data — like market index prices and trading volumes — to determine which features are most effective at that moment. This is achieved through a gating mechanism that dynamically adjusts feature importance based on market behavior.
For instance, during a sudden market downturn, the model might prioritize volatility indicators to capture rapid price movements. In contrast, during steady growth periods, it may focus on momentum signals. This adaptability ensures the model stays relevant across different market scenarios, making it both efficient and accurate.
3. Efficiency in Handling Complex Data
Stock price forecasting involves massive amounts of data, especially when analyzing the behavior of hundreds or thousands of stocks across multiple time steps. Performing pairwise comparisons for all stocks at every time step would be computationally expensive and impractical.
The model addresses this challenge by alternating between intra-stock and inter-stock analysis. Here’s why this matters:
Intra-Stock Aggregation focuses on uncovering patterns within a single stock’s historical data, reducing the complexity to a manageable level.
Inter-Stock Aggregation then identifies correlations between stocks at specific time steps, focusing only on the most relevant relationships.
By breaking the analysis into these two steps, the model avoids the need to directly analyze all stock-time pairs, which would be computationally prohibitive. This structured approach improves efficiency while ensuring the model captures both internal stock patterns and external correlations effectively.
This efficiency makes the model scalable, allowing it to handle large datasets without sacrificing performance.
