

Develop an app for finding underpriced apartments
Those who have ever searched for an apartment know how frustrating it can be. In addition to being time-consuming, how do you know if the apartment you like is the best fit?

It is most likely that you have a target budget and a target location in mind. You are, however, also willing to make a few trade-offs if you are anything like me. Having an amenity like the subway nearby, for instance, is very important to me in New York City. What is the value of that? If I lived in an elevator-equipped building, should I trade it for being nearer to the train? Can you tell me how long it takes to walk up a flight of stairs to reach the train? These are just a few of the many questions to consider when renting. In order to make such decisions, how can we use machine learning?
Throughout this chapter, we’ll explore just that. By the end of this chapter, we’ll have created an application that will make finding the right apartment just a little bit easier. We won’t be able to answer all of the questions we have (for reasons that will become apparent later), but we will have created an application that will simplify the search for the right apartment.
This chapter covers the following topics:
Finding apartment listings
Preparing and inspecting the data
Analyzing the data visually
Analyzing regressions
Predictions
Finding apartment listings
A broker charged a fixed commission of nearly 1% if you wanted to purchase a stock in the early 1970s. A travel agent would earn a commission of around 7% if you wanted to purchase an airline ticket. A real estate agent earns a commission of 6% when you sell a home. The first two can be done essentially for free in 2018. One of them remains unchanged from the 1970s.
Is there any connection between any of this and machine learning? Data is the key, and whoever has access to it determines the outcome.
Through APIs or web scraping real estate websites, you might assume you could easily access troves of real estate listing data. That’s not true. That’s wrong if you intend to follow those sites’ terms and conditions.
NAR, which runs the Multiple Listing Service (MLS), controls real estate data tightly. Brokers and agents can only access this service at great expense, which aggregates listing data. Therefore, they aren’t keen on allowing anyone to download it en masse.
Despite the fact that releasing this data would inevitably lead to useful applications for consumers, this is unfortunate. An important consideration for a family’s largest purchase is that it represents the largest portion of the family’s budget.
Nevertheless, not all sites explicitly prohibit scraping, so all hope is not lost.
Obtaining listing information
The RentHop website,
http://www.renthop.com,
will be our source of listing data. The RentHop website,
http://www.renthop.com,
will be our source of listing data.
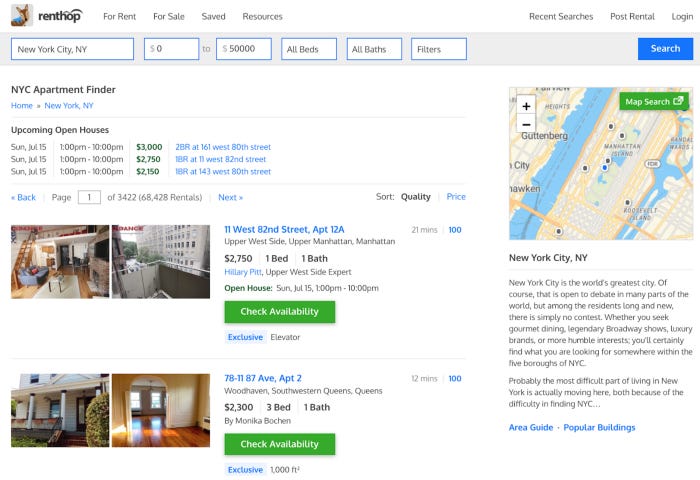
There is an address, a price, a number of bedrooms, and a number of bathrooms on the listings. For each listing, we will begin by retrieving this information.
The Python Requests library will be used for this task. The Requests protocol, which humans call HTTP, simplifies the process of retrieving websites. The quick start guide for Requests is available at http://docs.python-requests.org/en/master/user/quickstart/. The steps are as follows:
So, let’s begin by preparing our Jupyter Notebook for this task by adding the imports we’ll need. Following is a code snippet that illustrates how to do that:
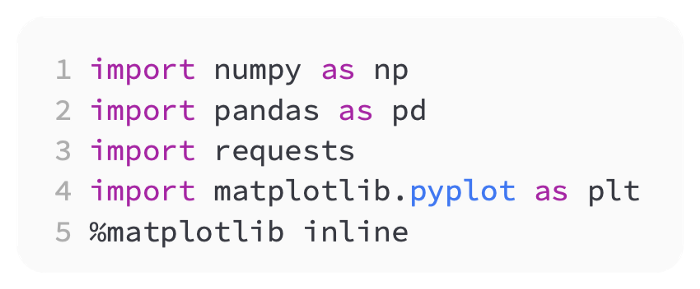
For now, we should be able to get started with these libraries, but there may be more libraries to import later on.
In our model, we will use NYC apartment data. RentHop / New York / Apartments for Rent is the URL for that data. Let’s test that the page can be retrieved. The following code shows how to do that:
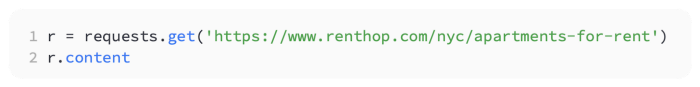
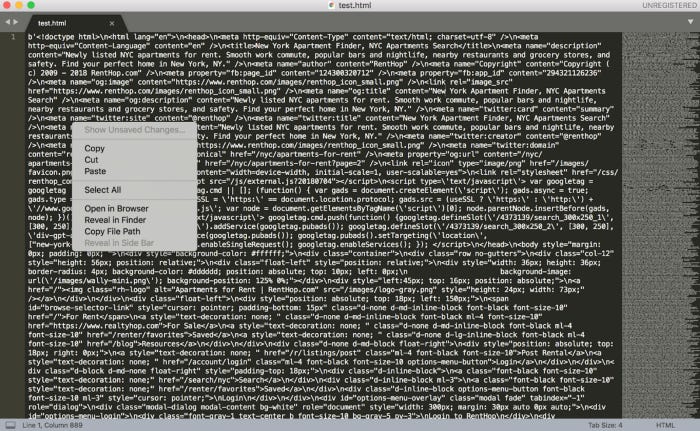
A call to the site is made, and the information is retrieved and stored in an R object. The r object contains a number of attributes, but we only need the page content at the moment. The following screenshot shows the output:
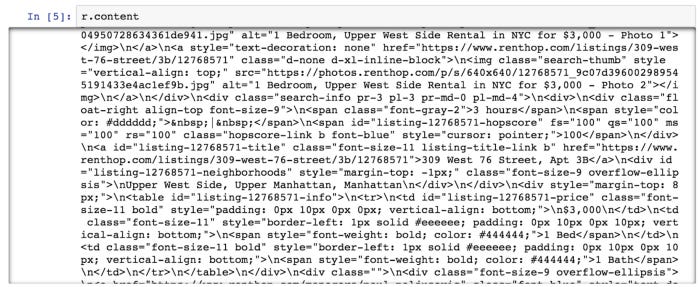
As far as I can tell, this contains everything we need. We can verify that by copying all the HTML and pasting it into a text editor, then opening it in a browser. Using Sublime Text, which can be found at https://www.sublimetext.com/, I will do that.
Below, you can see that I copied the HTML from the Jupyter output and pasted it into Sublime Text:
HTML text
The next step is to click Open in Browser, and we see something similar to this:
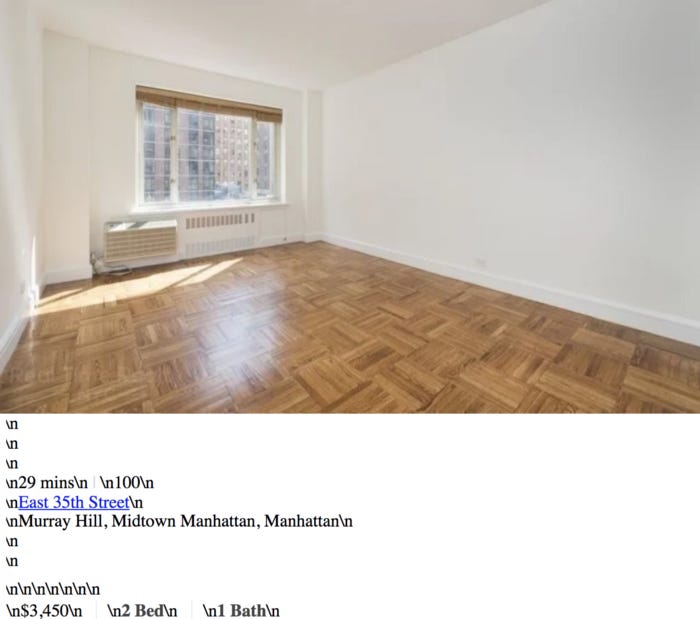
We can still see all the data we’re targeting, even though the text doesn’t render cleanly (due to the lack of CSS). Because of this, we won’t have to worry about advanced JavaScript rendering on the RentHop site. Using a tool like Selenium would be necessary if it did.
To parse the page data, let’s examine the page elements:
Right-click anywhere on the RentHop site in Chrome.
The Inspect option should be at the bottom of the context menu. There is a link there. You should now be able to see the following image on the page:
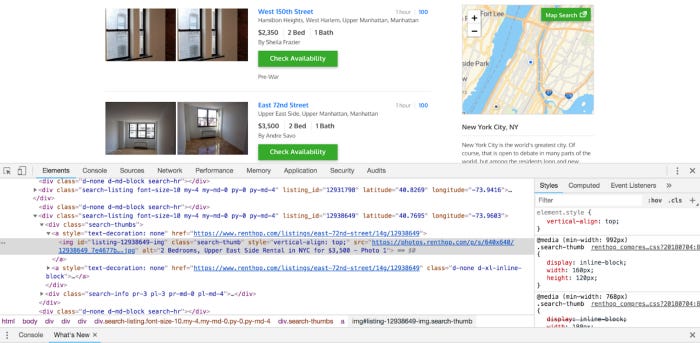
You will find an arrow in the corner of the square in the upper left-hand corner of the tool that just opened. On the page, click the data, and then click that. Here’s how it should look:
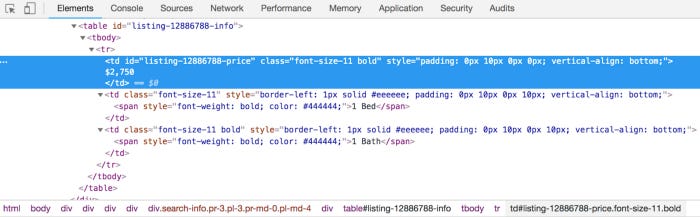
According to this, each listing’s data is in a table with a price tag, a bedroom tag, and a bathroom tag in the third place. The first td tag contains the price, while the second tag contains the number of bedrooms. A tag or anchor will also provide the apartment’s address.
As we build out our code to parse the data, let’s test it. BeautifulSoup will be used to parse our HTML. You can find the documentation for it at https://www.crummy.com/software/BeautifulSoup/. The BeautifulSoup Python HTML parsing library is popular and easy to use. If you do not already have pip installed, you can install it. Using it, we will be able to pull out all of the specifications for each apartment listing:
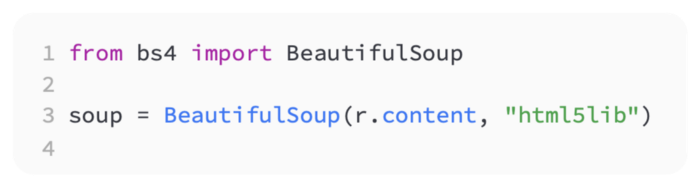
Our page content needs to be passed to the BeautifulSoup class to get started. Code showing this is as follows:
We can now begin parsing out our apartment data using this soup object we created. In order to get our listing data from the page, we must first retrieve that div tag. In the code below, we see that:
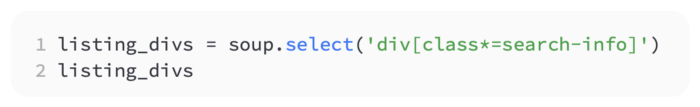
By selecting all divs containing search-info, we have achieved what we wanted. We have data in these exact divs.
As we can see in the following screenshot, the output is as follows:
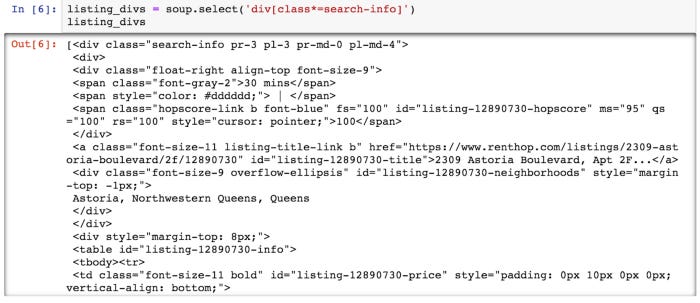
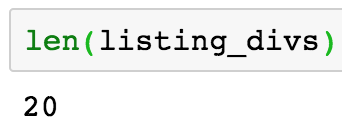
In the Python list, you can see that we have a list of all of the div tags we are looking for. From looking at the page, we know there should be twenty of them. Here’s what we need to confirm:
After capturing them all as desired, we see the following output:
Data points are pulled out one by one
We need to pull out the individual data points for each apartment from the divs with our listing data.
We want to focus on the following points in each:
The listing’s URL
The apartment’s address
Locality
Rooms
The number of bathrooms
It would be great if we had more information, such as square footage, but we’ll have to make due with what we have.
The first listing is as follows:
Following is the output of the preceding code:
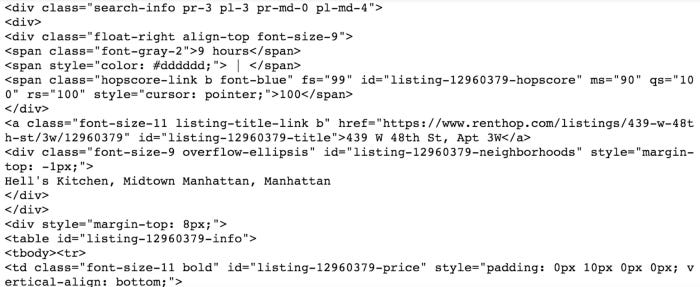
There are all the data points we were looking for in this first div. To target each of them individually, we just need to begin parsing. First, let’s look at the URL.
The URL for the page contains an anchor, or a tag. Let’s break that down now. Another select statement can be used to accomplish that, as shown in the following code snippet:
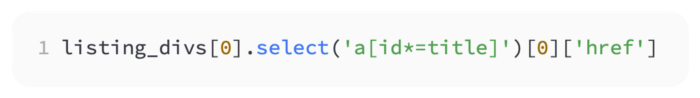
The following screenshot shows the output:

We were looking forward to this outcome. The rest of the listing’s data points can now be retrieved. The code for that is as follows:
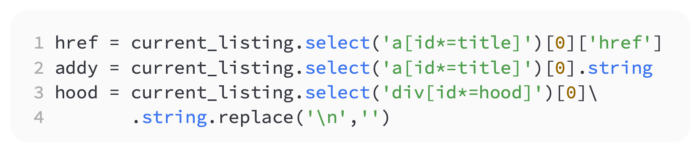
Here is what we’ve captured. Let’s verify it by printing it out. This is done in the following code:
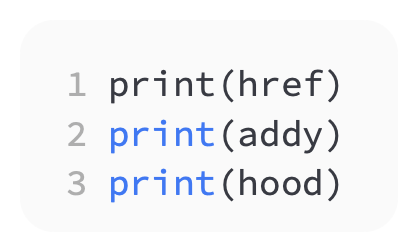
Following is the output of the preceding code:
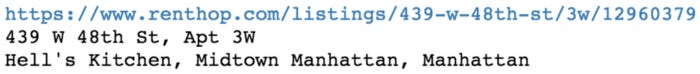
As a result of this output, we are able to get the data we need. The bedrooms, bathrooms, and price are the last items we need to consider.
We will need to iterate over each point since they are in a table tag in our div and then inside a table row, or tr. The following code shows how to do that:
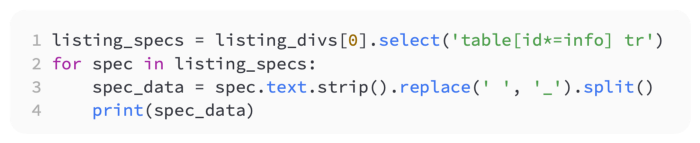
Following is the output of the preceding code:

I am pleased to see that we found exactly what we were looking for. The data we were seeking is now available to us. Now let’s loop through each listing and save the data into a list by pulling the data from each listing.
Each listing’s data points will be pulled out in the following code:
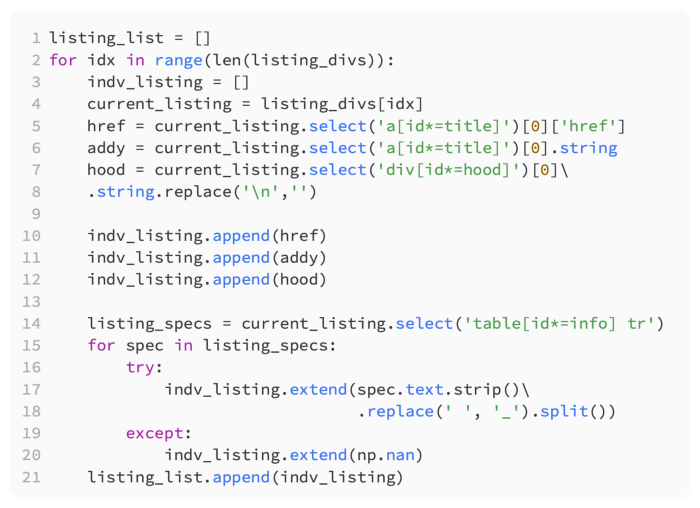
Now let’s unpack the previous code a bit. In our for loop, we go through each of the 20 divs on the page and extract the apartment listing data and add it to indv_listing. In the listing_list, which contains all the final information for the 20 apartment listings, all the data for each listing is then added. Using the following code, we can verify that:
Based on the preceding code, the following output is produced:
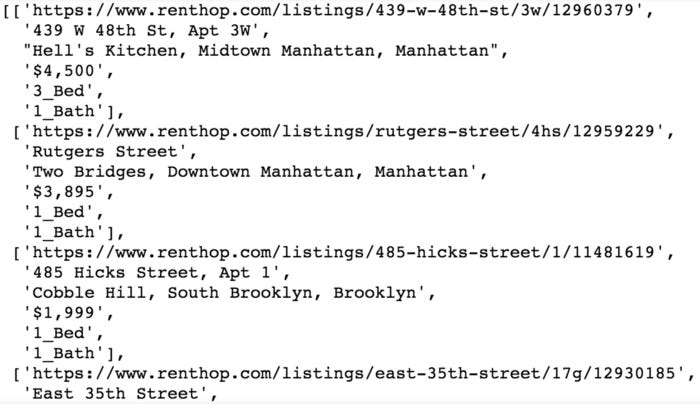
The results seem to be what we expected, so we will continue. Listing_list also confirms that all 20 apartments are listed.
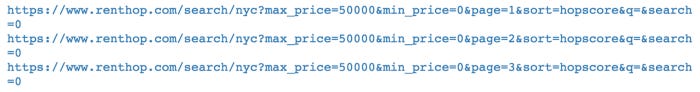
The data on one page has been successfully retrieved so far. In order to make any kind of meaningful model, we’re going to need much more apartments. Iterating over a number of pages will be necessary to accomplish this. In order to accomplish this, we will need to use the correct URLs. The listing contains a Next button at the bottom. The URL looks like the following if you right-click the button and choose Copy Link Address:
https://www.renthop.com/search/nyc?max_price=50000&min_price=0&page=2&sort=hopscore&q=&search=0.
Data parsing
Based on a basic analysis of the URL, we can conclude that we are passing parameters such as min price and max price, but the most important parameter is the page number. By using a loop, we can dynamically change the page number in our code to pull additional pages.
With some sample code, let’s try this:
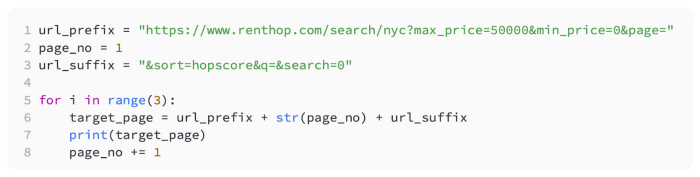
Following is the output of the preceding code:
It looks like this was a success. Putting it all together is now the only thing left to do. Our first step will be to convert our parsing loop into a function that can be called for each page. Here’s how we do it:
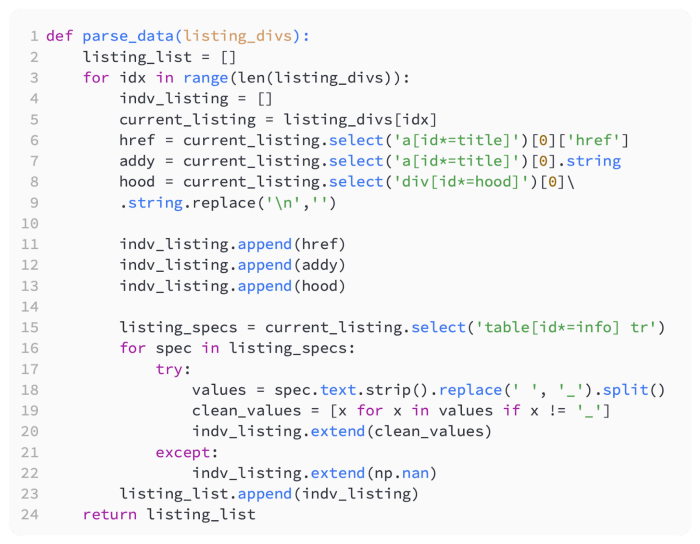
Data payloads for each listing_div will be returned by this function when given a page full of listing_divs. In this way, we can continue adding apartment data to our master list. In the listing_spec loop, some erroneous ‘_’ values are removed by adding some additional code to validate. In order to avoid some bad parsing that added an extra column when there shouldn’t have been, it was necessary to add this column.
Our next step is to construct the main loop that retrieves each page, parses out each listing’s data points, and ends the process by adding all of the data points to our final Python list of all listings’ data points. As a result, we write the following code:
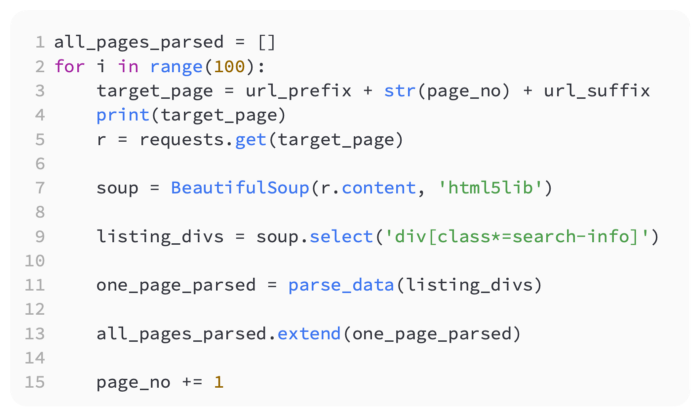
It would be a good idea to verify that it works on a much smaller number, such as three, before trying it on 100.
During the execution of the code, you should have noticed the page being printed out. It should be evident in your all_pages_parsed list that there are 2,000 listings if you used 30 pages.
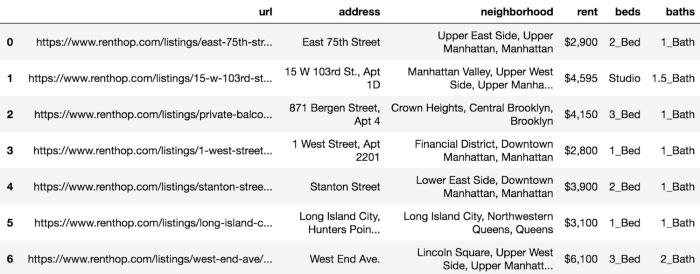
To make working with the data easier, let’s move it to a pandas DataFrame. In the following code, we do that:
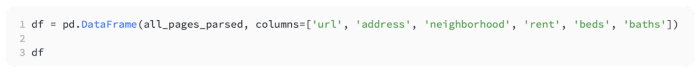
Following is the output of the preceding code:
Let’s move on to cleansing and verifying our data now that we have all our data pulled from external sources, parsed, and incorporated into a DataFrame.
Data inspection and preparation
To begin, let’s examine the data points in each column. Our data should be checked for outliers and odd values. First, let’s look at the columns for bedrooms and bathrooms:
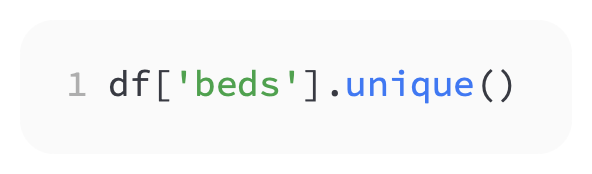
We look at bedrooms’ unique values in the following code:

Following is the output of the preceding code:

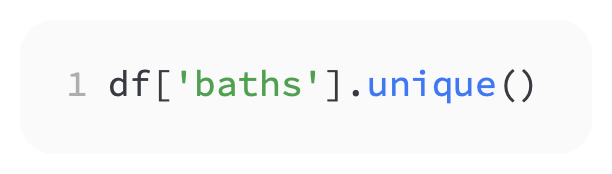
The next topic we’ll discuss is bathrooms. The code for that is as follows:

Following is the output of the preceding code:

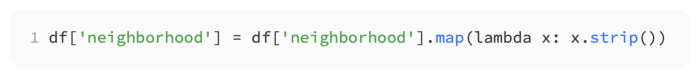
As a result of the two preceding queries, we see that some items have a leading underscore that needs to be corrected. Here’s what we need to do:
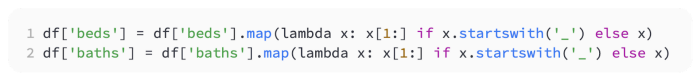
The above code runs a pandas map function with a lambda function that removes underscores from elements that begin with underscores. Our erroneous starting underscores have been removed from the unique values for beds and baths:
Following is the output of the preceding code:

The following code should be executed and the results should be seen:
Following is the output of the preceding code:

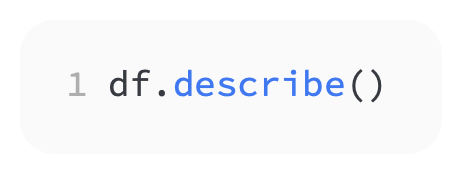
The next step is to examine some descriptive statistics in order to better understand our data. Using the describe method is one way to accomplish this. Take a look at the following code to see if that works:
Following is the output of the preceding code:
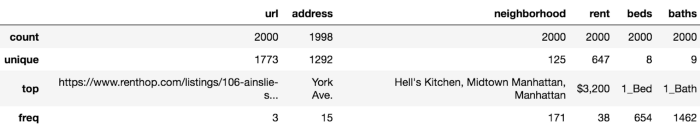
In contrast to what we were hoping for, we did not receive metrics such as the average number of beds and baths or the maximum rent. This is due to the incorrect data type of the data. Those types of operations cannot be performed by Pandas on string objects. To set the data types correctly, we will need to clean up our data further. Here is the code we will use:
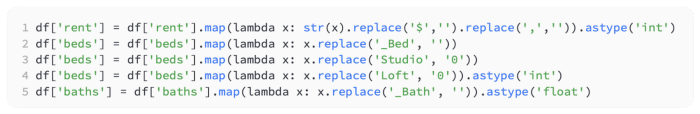
In the following code, we have removed anything that is not a number from each value. The _Bed and _Bath have been removed so that only the number remains, and we have replaced words such as Studio and Loft with the actual number of bedrooms.
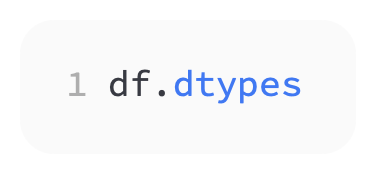
An overview of the data types
The types of data we have are as follows:
Following is the output of the preceding code:
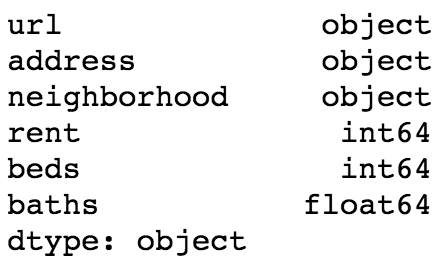
That’s what we’re looking for. A float was needed instead of an integer since a half bath is possible.
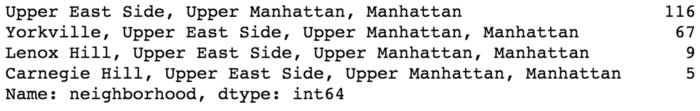
Our next step will be to inspect the property. To find out how many units there are in each neighborhood, let’s do the following:
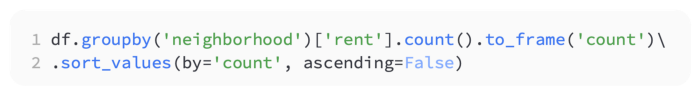
Following is the output of the preceding code:
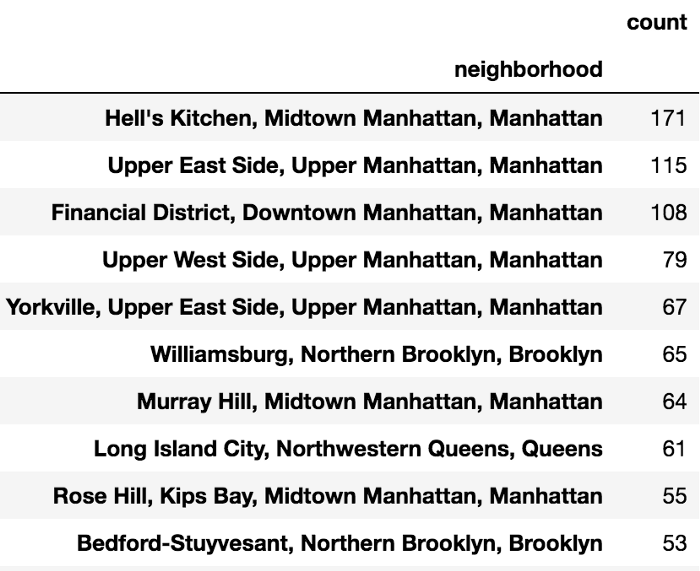
Manhattan appears to have most of the units, as might be expected. Let’s keep the strings in our neighborhood clean. Several groupby operations can be used to accomplish this:

Following is the output of the preceding code:
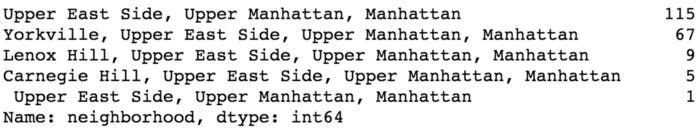
There appears to be a problem with leading and/or trailing spaces. I’d like to clean that up. The code for this is as follows:
I hope that clarifies things. This needs to be validated:

Following is the output of the preceding code:
That’s great. This is exactly what we are looking for. There are still a few inspections to be done at this point. I’ll just show you the mean rent by neighborhood:
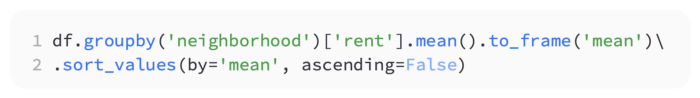
Following is the output of the preceding code:
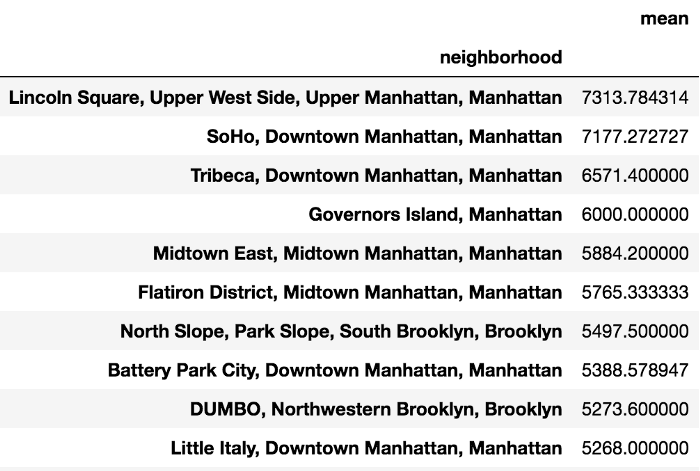
In Lincoln Square, we see that the average rent is the highest. Let’s examine the data visually rather than query for interesting patterns at this point.
Analyzing our data visually
Plotting geographic data, as we are doing here, is incredibly valuable when dealing with geographic data. In order to do that, you can use something called a choropleth map. The choropleth is essentially a heat map for a geographic area. Choropleths are used to create heat maps showing average rental prices based on ZIP codes.
The ZIP code is the first thing we need to know. Zip codes are not included in our dataset, which is a disappointment for us. The properties’ addresses, however, are available. We can retrieve this information using Google Maps API.
There is currently a fee associated with the Google Maps API. You get a credit of $200 every month (at the time of writing) along with the reasonable rates. In addition, they offer a free trial before billing you, and they won’t charge you unless you explicitly allow it. We’ll go ahead and create an account since there really is no free alternative. Following is a step-by-step guide:
