


Everything About k-Nearest Neighbors
Everything About k-Nearest Neighbors
If you were trying to predict my vote in the next presidential election, how would you do it?

If you were trying to predict my vote in the next presidential election, how would you do it? Considering what my neighbors are planning to vote (and if you have the data), might be an interesting approach. In Seattle, as I do, my neighbors are almost always planning to vote for the Democratic candidate, so I would guess that I would also vote for a Democrat.
Consider that you know more about me than just my location - perhaps my age, my income, my number of kids, etc. Among all my neighbors, looking at those who are close to me seems likely to be even more accurate than looking at all of them to assess how my behavior is influenced (or characterized) by them. The nearest neighbor classification is based on this concept.
The Model
There are many predictive models, but one of the simplest is nearest neighbors. In addition, it doesn't require any heavy machinery or mathematical assumptions. There are only a few requirements:
Distance in some sense
A similarity assumption between points that are close to each other
This book discusses techniques for learning patterns in data by looking at the dataset as a whole. The nearest neighbors method, however, deliberately ignores a lot of information, since the prediction is based only on a few points nearby.
What's more, you won't be able to understand the drivers of whatever phenomenon you're studying by looking at nearest neighbors. A model that predicts my vote based on (say) my income and marital status may be more useful in determining why I vote the way I do rather than predicting it based on my neighbors' votes.
There are some data points and corresponding labels in the general situation. For example, each input could be identified with a True or False label that indicates whether it meets a certain condition, such as “is spam” or “is poisonous” or “would be enjoyable to watch. ” They could also be categories, such as movie ratings (G, PG, PG-13, R, NC-17). Candidates' names could also appear there. It could also be a favorite programming language.
Suppose we pick a number k like 3 or 5. We then let the k nearest labeled points vote on the new output when we want to classify some new data point.
Vote counting is needed for this. The following is one possibility:

There's nothing intelligent about this when it comes to ties. Think about it: we're rating movies and the five closest movies have ratings of G, G, PG, PG, and R. G receives two votes, and PG receives two votes. The following options are available in that case:
A random winner will be chosen.
Calculate the weighted winner by weighing the votes by distance.
Find a unique winner by reducing k.
The third step will be implemented as follows:
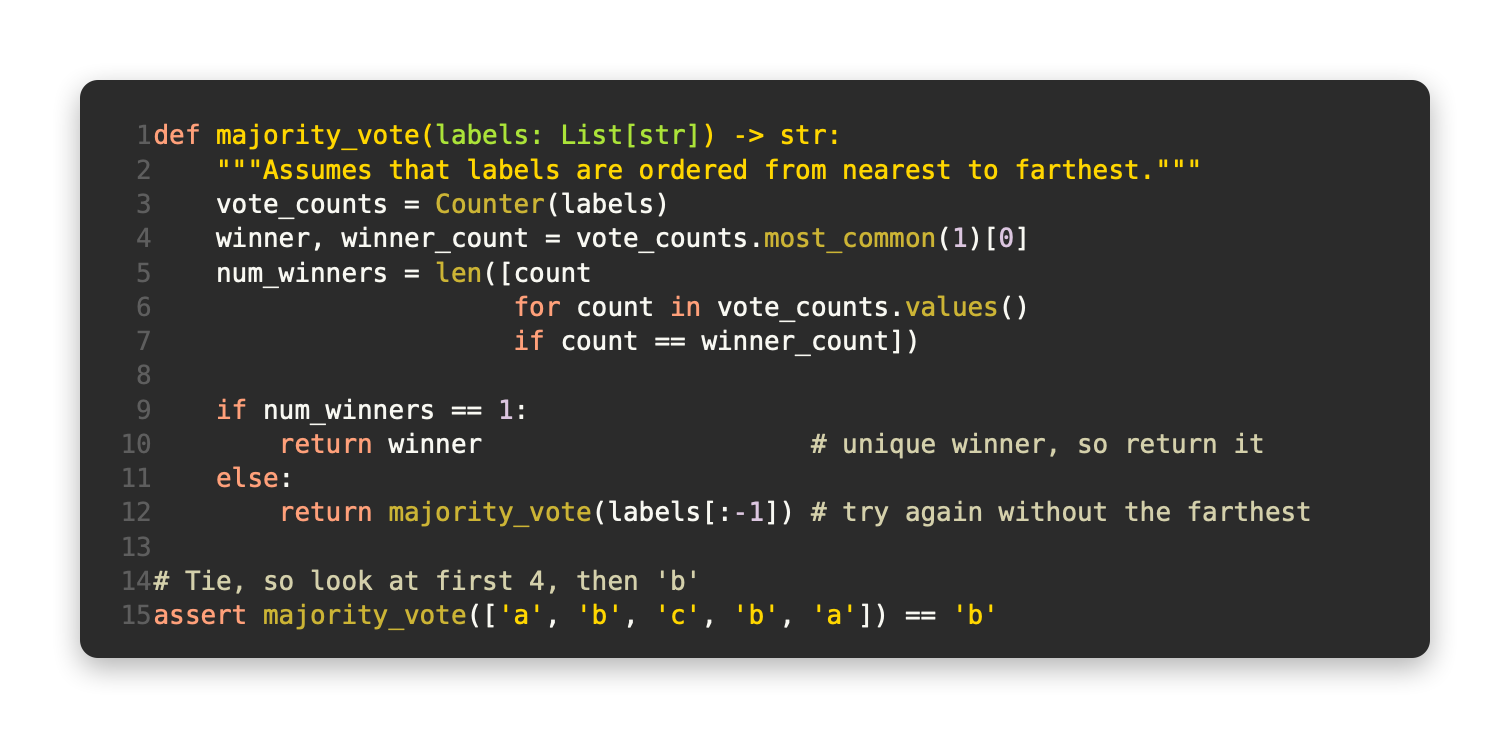
We will eventually succeed with this approach, since in the worst case, we will only have one label, which will win.
You can easily create a classifier using this function:

This is how it works, so let's see how it works.
The Iris dataset is an example
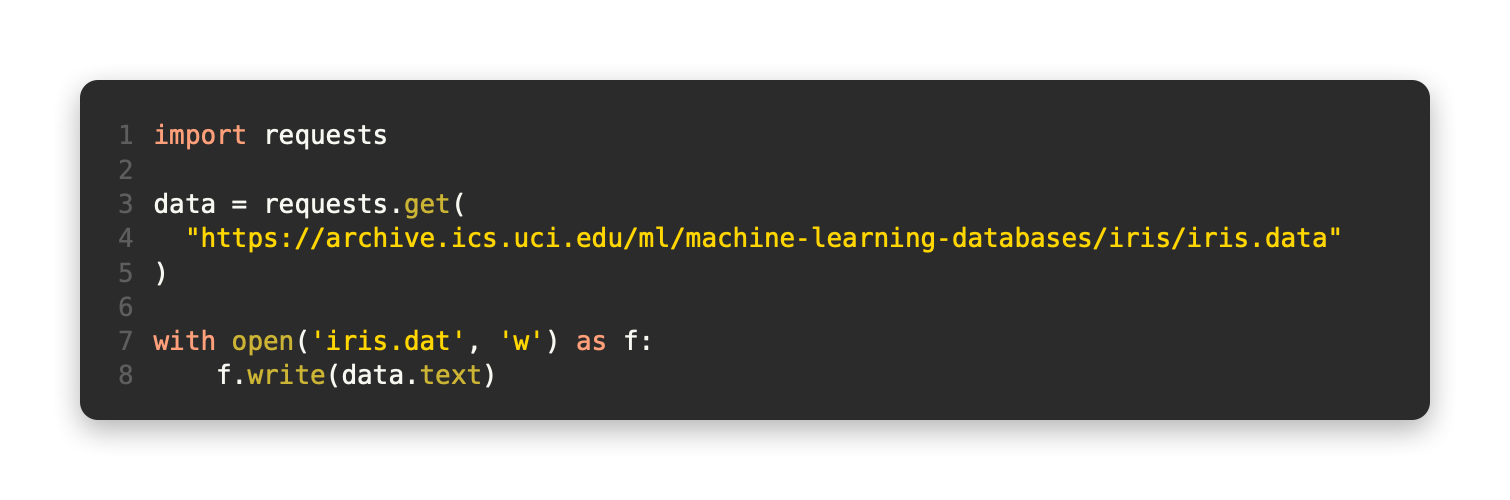
Machine learning relies heavily on the Iris dataset. Three species of iris are represented by 150 flowers measured. The length, width, and length of the sepals, as well as the species, are available for each flower. It is available at https://archive.ics.uci.edu/ml/datasets/iris:
Data is separated by commas and includes the following fields:
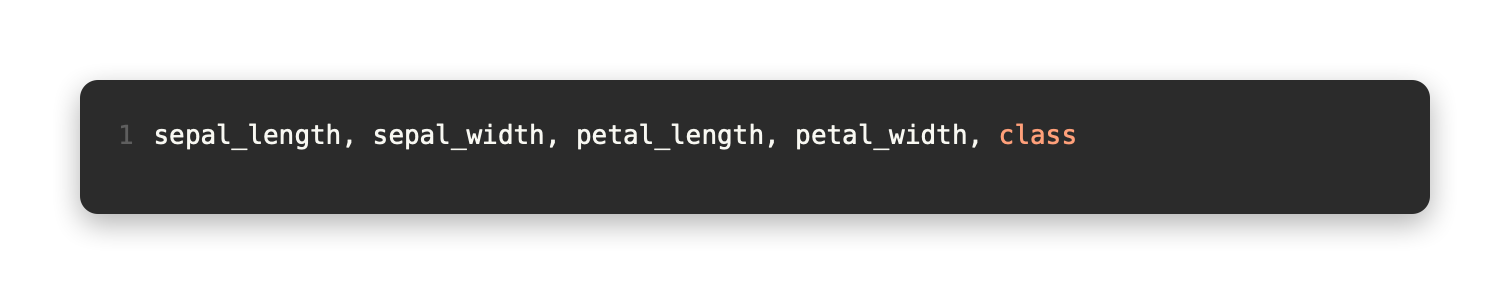
The first row, for example, looks like this:

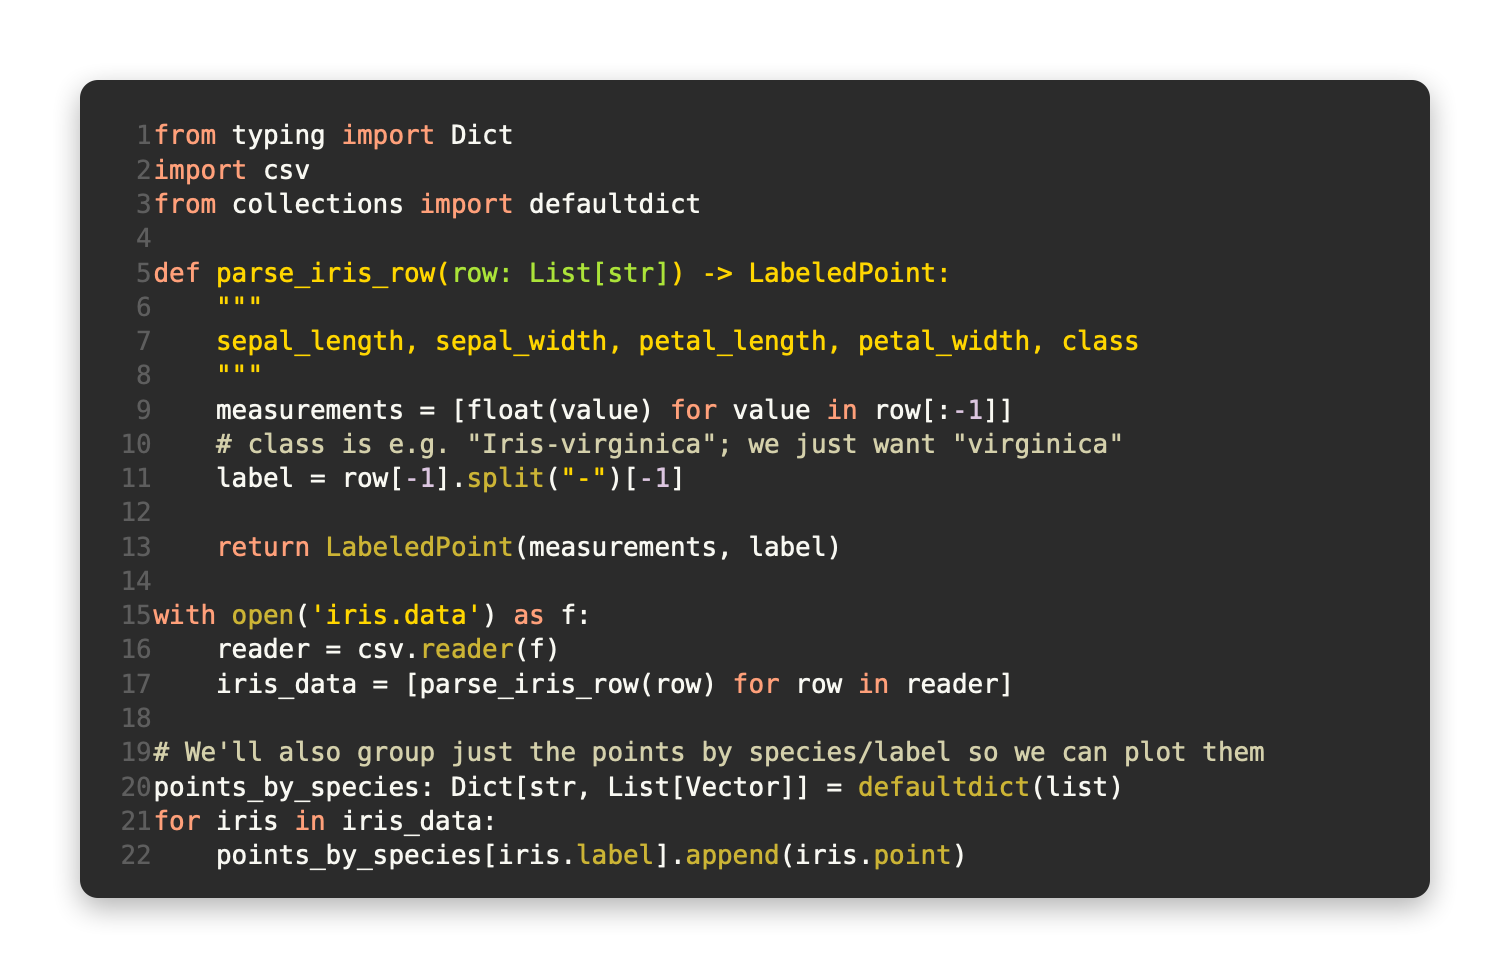
Using the first four measurements, we will build a model to predict the species (the class).
We'll start by loading and exploring the data. To represent our data in the format expected by the nearest neighbors function, let's use LabeledPoints:
The measurements should be plotted so we can see how they vary by species. It is difficult to plot them because they are four-dimensional. To examine the scatterplots for each of the six measurements pairs (Figure 12-1), we can look at the scatterplots for each pair. Although I won't go into all the details, it's an excellent example of what matplotlib can do for more complicated plots:

Figure 12-1. Scatterplots of iris
There is a clear clustering of measurements by species if you look at those plots. It is probably impossible to distinguish versicolor from virginica based solely on the length and width of the sepals. The nearest neighbors should, however, enable you to predict species when you add petal length and width into the mix.