

Forecasting Stock Prices With Deep Learning
In the dynamic landscape of stock market analysis, the blend of coding and finance has emerged as a pivotal skill set.

This article is a deep dive into the world of coding for financial forecasting, specifically through the lens of Deep Learning. We will be harnessing Python’s powerful coding tools — Pandas for data manipulation, NumPy for numerical analysis, and Matplotlib for visual insights — to predict stock market trends. Geared towards coders, data enthusiasts, and financial analysts, this piece demystifies the complex algorithms and coding strategies behind stock price predictions. Join me on this coding expedition as we unlock the secrets of financial data and learn how to make informed predictions in the stock market using the most advanced tools in our coding arsenal.
Loading And Handling Data Into Pandas
import pandas as pd
import numpy as np
import matplotlib.pylab as plt
%matplotlib inline
from matplotlib.pylab import rcParams
rcParams['figure.figsize'] = 15, 6
This code loads essential tools for analyzing and visualizing data. It brings in the pandas, numpy, and matplotlib libraries and renames them as pd, np, and plt to keep things short and clear. The %matplotlib inline command lets us see our graphs inside the notebook. We then adjust the default size of the graphs to be bigger 15x6 for better visibility. Finally, we use the rcParams to tweak how our graphs look, changing things like the axes and colors. In short, this code prepares the environment for data work.
data = pd.read_csv('/home/sash/Documents/Sem_6/SMAI/Major_Project/Final-Data/FB.csv')
print data.head()
print '\n Data Types:'
print data.dtypes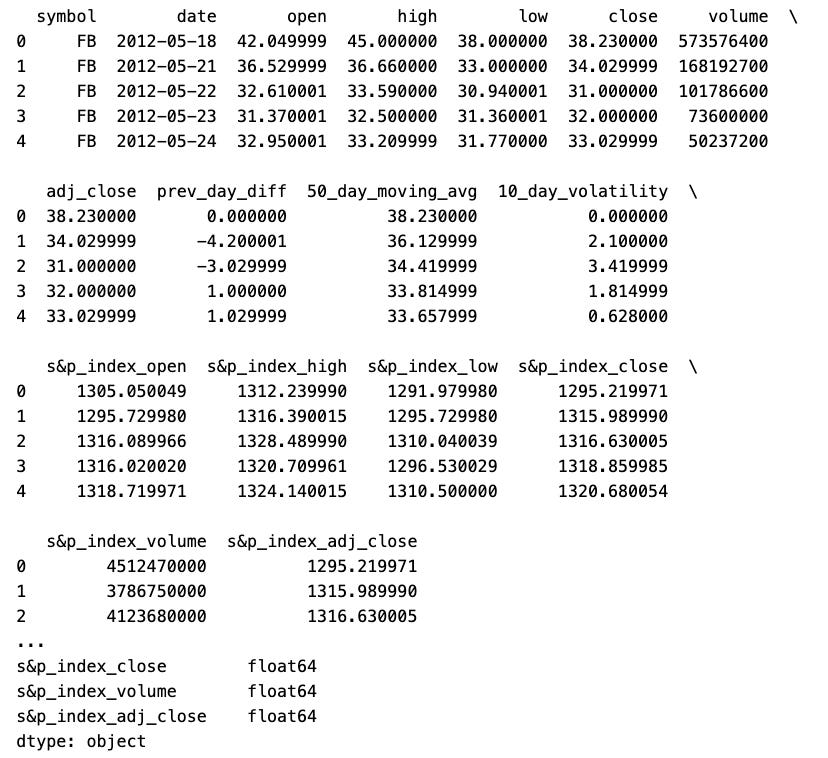
The code imports the pandas library as pd, reads a CSV file of Facebook data from a given path, and displays the first few rows with the head function. It then prints an empty line followed by the data types of each column. This code helps to easily view and grasp the datasets structure and contents.
Reading As Datetime Format
dateparse = lambda dates: pd.datetime.strptime(dates, '%Y-%m-%d')
# dateparse('1962-01')
data = pd.read_csv('/home/sash/Documents/Sem_6/SMAI/Major_Project/Final-Data/FB.csv', parse_dates='date', \
                   index_col='date',date_parser=dateparse)
print data.head()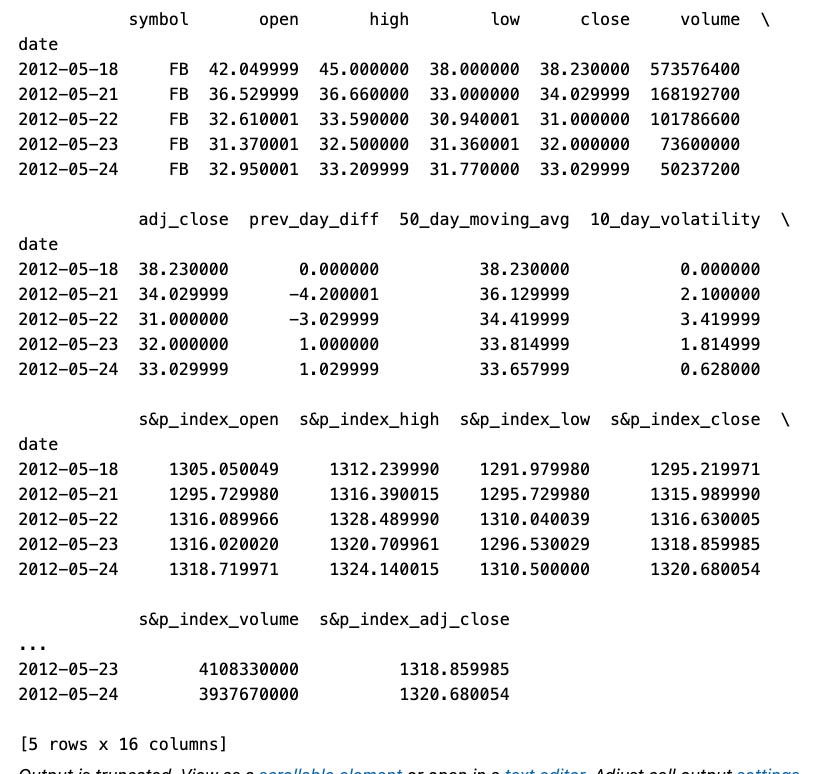
This code defines a simple dateparse function to convert dates into datetime format and applies it to the 1962–01 input, storing the result in a variable data. It then reads a CSV file from a specific path, parses the date column as datetime using dateparse, sets this column as the dataframes index, and displays the first few rows of the dataframe.
