


Harnessing Machine Learning for Pairs Trading Strategy
A Comprehensive Guide to Cluster-Based Stock Analysis

In the dynamic realm of financial trading, machine learning offers an innovative edge, particularly in the strategy of pairs trading. This guide delves into the intricacies of utilizing machine learning techniques to identify and capitalize on mean-reverting relationships in stock pairs. By blending pricing data with fundamental and industry-specific insights, the approach aims to uncover hidden correlations and patterns in the stock market.
The Link is to source code is at the end of this article. Download it from there.
The journey begins with a thorough analysis of stocks, categorizing them into distinct clusters based on a variety of factors. Leveraging algorithms like Principal Component Analysis (PCA) and DBSCAN for unsupervised learning, the methodology focuses on dimensionality reduction and sensible clustering. This process not only simplifies the vast financial data but also reveals promising stock pairs for further investigation. The guide will walk you through each step of this sophisticated process, from initial data standardization to the final selection of stock pairs, offering a clear path to mastering pairs trading with machine learning.
import matplotlib.pyplot as plt
import matplotlib.cm as cm

import numpy as np
import pandas as pd

from sklearn.cluster import KMeans, DBSCAN
from sklearn.decomposition import PCA
from sklearn.manifold import TSNE
from sklearn import preprocessing
from sklearn.preprocessing import StandardScaler

from statsmodels.tsa.stattools import coint

from scipy import stats

from quantopian.pipeline.data import morningstar
from quantopian.pipeline.filters.morningstar import Q500US, Q1500US, Q3000US
from quantopian.pipeline import Pipeline
from quantopian.research import run_pipeline
To analyze data and perform machine learning, this code imports many libraries, such as matplotlib, sklearn, statsmodels, and quantopian. Using the import matplotlib.pyplot as plt line, you can create charts and plots using the pyplot submodule of the matplotlib library. The import matplotlib.cm as cm line imports the color-maps submodule found in matplotlib.cm. Importing numpy and pandas, which manipulate and analyze data, is done with import numpy and import pandas lines. TSNE and PCA import specific submodules from the SkLearn library, which reduce dimensionality. Import Preprocessing and Import StandardScaler import additional submodules from sklearn. This line imports a specific function from statsmodels.
Finally, the quantopian lines import specific modules and functions from the quantopian library, which is a platform for algorithmic trading. Data analysis and machine learning tasks are performed using the imported libraries and functions. Clustering is performed via KMeans and DBSCAN algorithms from the Sklearn library, while dimensionality reduction is performed via PCA, and statistical analysis is performed using coint from statsmodels. Using the quantopian library, you can also create customized trading strategies and analysis. It is primarily used in algorithmic trading and research for data analysis, preprocessing, and modeling.
Acquire Stock Info
study_date = "2016-12-31"

universe = Q1500US()

pipe = Pipeline(
    columns= {
        'Market Cap': morningstar.valuation.market_cap.latest.quantiles(5),
        'Industry': morningstar.asset_classification.morningstar_industry_group_code.latest,
        'Financial Health': morningstar.asset_classification.financial_health_grade.latest
    },
    screen=universe
)

res = run_pipeline(pipe, study_date, study_date)
res.index = res.index.droplevel(0)  # drop the single date from the multi-index

print res.shape
# print res.head()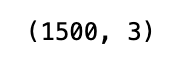
An analysis of financial performance is run using the Quantopian platform, coded in Python. A study_date value of 2016–12–31 is assigned to the variable in the first line. A universe variable is created using Q1500US in the following line. The function defines a set of stocks based on certain parameters such as market capitalization for analysis. Using the Pipeline function, a pipeline is created. Analyzing these columns of data is specified by this pipeline. Market cap, industry, and financial health grades are included in these columns. Stocks to be analyzed are specified by the screen parameter. The run_pipeline function is used to run the pipeline after it is defined. In this case, the start and end dates are the same for the pipeline created earlier and the analysis pipeline. As a result, the variable res is set to the result. On the next line, the multi-index is stripped of its date, leaving only stock symbols and their associated data. For analysis, the dataframe’s shape and the first few rows are printed.
Remove Undesired Stocks
# remove stocks in Industry "Conglomerates"
res = res[res['Industry']!=31055]
print res.shape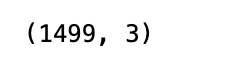
Stocks in the Conglomerates industry are removed from the dataset represented by res by this code. Conglomerates is the industry code 31055. Using a boolean expression, the code filters the dataset to remove all rows without the value 31055 in the Industry column. In the next step, the resulting dataset is saved back into the variable res. At the end of the code, the resulting dataset’s shape is printed, which tells us how many rows and columns there are in it after the filter. Seeing the effect of the filter allows the user to verify that stocks in the Conglomerates industry are no longer showing.
# replace the categorical data with numerical scores per the docs
res['Financial Health'] = res['Financial Health'].astype('object')
health_dict = {u'A': 0.1,
               u'B': 0.3,
               u'C': 0.7,
               u'D': 0.9,
               u'F': 1.0}
res = res.replace({'Financial Health': health_dict})
The code replaces categorical data with numerical scores in a column called Financial Health. In the first step, the column is converted into an object datatype using the astype method. An alphabetic dictionary is created where each letter represents a numerical score of 0.1, 0.3, 0.7, 0.9, 1.0. By using the replace method, each letter in the column Financial Health is replaced with a corresponding numerical score. The use of numerical values provides easier data analysis and manipulation because they are easier to manipulate than categorical ones.
Define Time Horizon
pricing = get_pricing(
    symbols=res.index,
    fields='close_price',
    start_date=pd.Timestamp("2016-12-31"),
    end_date=pd.Timestamp("2017-12-31")
)
In this code, the get_pricing function is used to retrieve historical pricing data for symbols stored in the res variable, specifically their closing prices. Data start and end dates are 31 December 2016 and 31 December 2017, respectively, and are stored as pandas Timestamp objects. In the pricing variable, the function call result is stored. The code retrieves historical price data by selecting a symbol and a time period.
pricing.shape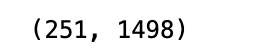
The Python code will return a tuple containing the pricing data object’s dimensions. It indicates the size of the data set by showing the number of rows and columns.
#change price to pct change
returns = pricing.pct_change()
# returns.head()
The code calculates the percentage change in price over time. Using the pct_change function on pricing data, the first line sets up a new variable called returns and assigns the result of it to the variable. With this function, you can calculate the percentage change between two price points based on the price data. During the second line, returns.head, the user is able to see the initial data points’ calculated percentage changes for the returns variable. It is useful for analyzing stock price changes or commodity prices over time using this code.
returns.shape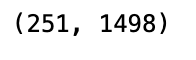
The code gets the dimensions of a NumPy array or Pandas DataFrame. Datasets are frequently checked to determine their number of rows and columns. Let’s take a closer look at how it works: returns is the name of a NumPy array or Pandas DataFrame. With .shape, you can find out the dimensions of a dataset in the form of a tuple (number of rows and columns). This case uses .shape without parentheses or arguments, which means it returns the dimensions of the returns dataset. As an example, runs returns.shape will return 100,5 if returns is a NumPy array with 100 rows and 5 columns. The array contains 100 rows and 5 columns. A dataset’s dimensions and size are easily checked by this code, which returns the number of rows and columns it contains.
# we can only work with stocks that have the full return series
returns = returns.iloc[1:,:].dropna(axis=1)
print returns.shape
# print returns.head()
It uses the method .iloc for indexing the column data by taking a variable returns. : means we are selecting all columns and 1: means we are selecting all rows. .dropnaaxis=1 drops missing column values. In this way, we can ensure that we are working with complete data. Next, the shape of the data is shown, along with the number of rows and columns. The last line prints a few rows of data using the .head command. As a result, we can inspect the data visually to verify that it is as expected.