


Java’s Approach to Memory and Concurrency
Java’s Approach to Memory and Concurrency
The purpose of this article is to introduce the Java platform’s handling of concurrency (multithreading) and memory.

It makes sense to treat these topics together, as they are intrinsically intertwined. Our discussion will include:
The memory management system in Java
GC (Garbage Collection) algorithm with mark-and-sweep
GC in the HotSpot JVM is optimized based on object lifetime
Primitives for concurrency in Java
Mutability and visibility of data
Java Memory Management Concepts
When an object is no longer required, its memory is automatically reclaimed. It is accomplished through a process called garbage collection (also known as automatic memory management). Languages such as Lisp have used garbage collection for years. In languages such as C and C++, where you must call the free() function or delete operator to reclaim memory, this can take some getting used to.
Garbage collection is handled differently by different VMs, and the specifications do not specify how it must be implemented. Our discussion of the HotSpot JVM (which is the basis of both Oracle’s Java implementation and OpenJDK’s) will follow later in this article. Among server-side deployments, it is the most common JVM, and provides a good example of a modern production JVM.
Java memory leaks
As a result of Java’s garbage collection support, memory leaks are greatly reduced. An allocation of memory that is never reclaimed constitutes a memory leak. Because garbage collection reclaims all unused objects, garbage collection might seem to prevent all memory leaks.
If an unused reference to a valid object is left hanging around in Java, the result can still be a memory leak. It is possible for local variables in a method to retain object references much longer than is actually necessary when it runs for a long time (or forever). Here’s an example:
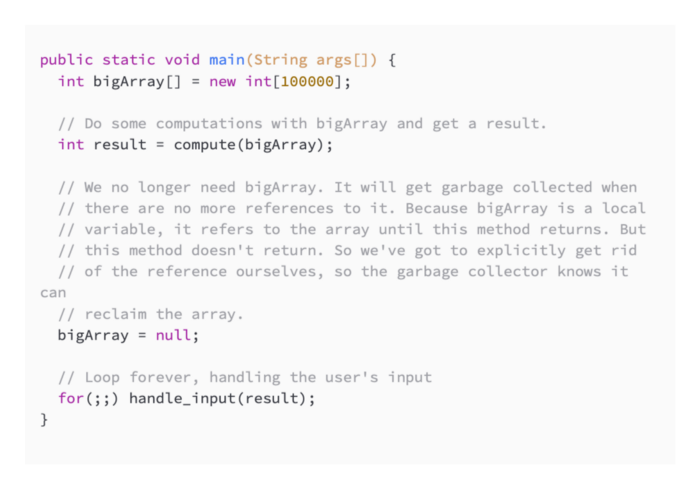
It is also possible for memory leaks to occur when objects are associated with each other through HashMaps or other similar data structures. The association remains in the hash table even when neither object is required anymore, preventing reclaiming the objects until the hash table is reclaimed. An object’s lifetime can be significantly longer than the hash table’s, resulting in memory leaks.
The Mark-and-Sweep method
Let’s assume there are two basic data structures that the JVM maintains to explain an example of the mark-and-sweep algorithm. They are as follows:
Allocation table
Contains references to all allocated objects (and arrays) that have not yet been collected
Free list
Lists the free and available blocks of memory
These definitions make it clear when GC is needed; it is necessary when Java threads try to allocate objects (using the new operator) after a block of insufficient size is found in the free list. Furthermore, the JVM is able to figure out which variables in each stack frame refer to which objects and arrays in the heap because it keeps type information about all allocations. Objects and arrays held in the heap can be traced through by the JVM by following references to all objects and arrays.
Runtimes can determine when allocated objects cease to be referenced by active objects and variables. In such cases, the interpreter knows it can safely reclaim the object’s memory and does so. In addition to detecting and reclaiming cycles between objects that reference each other, the garbage collector can also find and reclaim cycles between active objects.
In application stack traces, reachable objects are objects that can be reached starting from some local variable in a method, then following references until we reach them. The term “live” is also used to describe objects of this type.
Let’s examine a simple method based on these principles for performing garbage collection.
Algorithm for Mark-and-Sweep
Mark-and-sweep is the most common (and simplest) method of collecting data. Three phases are involved:
Mark each dead object in the allocation table iteratively.
Follow all references from all objects we reach, starting with the local variables that point to the heap. We should mark new objects or arrays as live whenever we reach them. Continue exploring all local variables until we’ve reached all references.
The allocation table should be swept again. Reclaim memory in heap for all objects that are not live and place them back on the free list. Allocation table should be cleared of the object.
The GC will trigger before the heap fills up because all objects are allocated from the allocation table. A GC must have exclusive access to the heap in this description of mark-and-sweep. Application code constantly runs, creates, and changes objects, which can result in corrupt results.
The heap memory of a real JVM is likely to have different parts, and real programs make use of each part in normal operation. The heap in Figure 1 is shown with references pointing to the heap from two threads (T1 and T2).
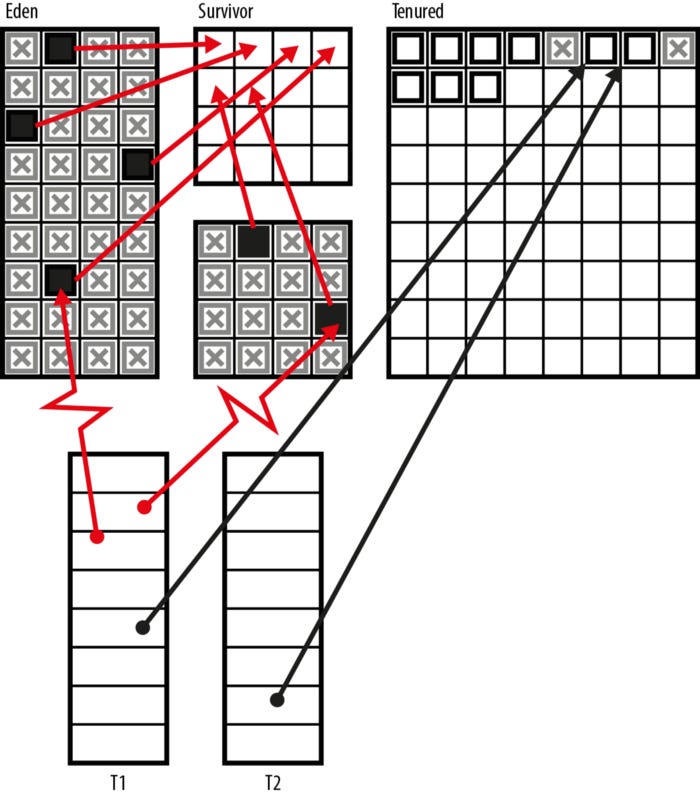
Figure 1. Heap structure
It is dangerous to move objects during the execution of a program that is referenced by application threads.
This can be avoided by using a simple GC, such as the one shown here. When it runs, all application threads will be stopped, then GC occurs, and then all application threads will be started up again. As threads reach a safe point, the runtime halts them — for instance, just before a loop starts or before a method is called. These execution points are known to the runtime as being safe for stopping application threads.
It is sometimes worrying for developers to see these pauses, but most mainstream Java usage is running on top of a system that switches processes on and off constantly, so it’s not usually an issue. As part of HotSpot, we optimized GC and reduced STW times when it was relevant to the application’s workload. Those optimizations will be discussed in the next section.
Garbage collection in the JVM: How it works
A great example of a runtime fact about software is the weak generational hypothesis (WGH). There are only a few possible generations (life expectancies) for objects.
A transient object usually lives for a short time before becoming eligible for garbage collection. Nonetheless, a small fraction of objects are destined to remain in the program’s longer-term state (also called the program’s working set). A plot of memory volume (or the number of objects created) against expected lifetime can be seen in Figure 2.
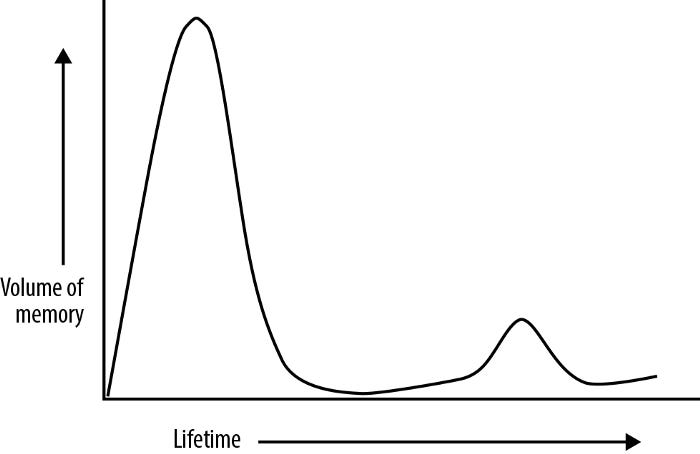
Figure 2. The generational hypothesis is weak
Despite not being deduced from static analysis, this fact is generally true across a wide range of workloads when we assess software’s runtime behavior.
In this section, we will discuss how the HotSpot JVM takes advantage of the weak generational hypothesis in its garbage collection subsystem for short-lived objects (which is the majority). The discussion applies directly to HotSpot, but similar techniques are often used by other server-class JVMs.
Generational garbage collectors are simply those that observe the WGH. In their view, being friendly to the WGH will more than offset some extra bookkeeping needed to monitor memory. A generational collector is usually composed of just two generations, referred to as the young and old generations.
Evacuation
With our original mark-and-sweep formulation, we returned individual objects to the free list during the cleanup phase. It may make sense to use an alternative method for reclaiming space if the WGH is true and the majority of objects are dead during a given GC cycle.
Separate memory spaces are created by dividing up the heap. A process called evacuation involves moving only live objects to a new space during each GC run. These collectors are called evacuating collectors, and they have the feature of wiping the entire memory space after each collection so that it can be reused.
As shown in figure 3, solid blocks represent objects that are surviving, and hatched boxes represent objects that are still alive, but are now dead (and unreachable).
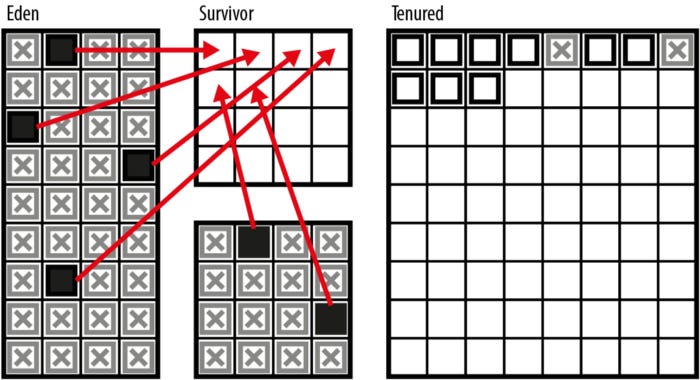
Figure 3. Collector evacuation
Since the dead objects are never touched, this is potentially a much more efficient approach than naive collection. The length of a GC cycle depends on the number of live objects rather than the number of allocated objects. In contrast to the enormous gains realized through evacuation strategies, the only downside is slightly more bookkeeping — we have to pay for the copying of the live objects.
A compacting collector is an alternative to an evacuating collector. Within the collected region, allocated memory (i.e., the surviving objects) is arranged in a single contiguous area at the end of the collection cycle.
In normal circumstances, all surviving objects are shuffled to the beginning of the memory range (or pool) after they have all been “shuffled up” within the memory pool (or region). Once application threads reopen, a pointer indicates the start of empty space into which objects can be written.
Memory fragmentation can be avoided by compacting collectors, but they are usually much more expensive in terms of CPU consumption than evacuating collectors. In Java (and in a number of other programming languages), both techniques are used in production collectors despite their design trade-offs.
Per-thread allocation is also possible with an evacuating collector. A thread-local allocation buffer provides each application thread with its own contiguous chunk of memory for allocating new objects. The only operation involved in allocating new objects is bumping a pointer in the allocation buffer.
It is unlikely that an object created just before a collection will have time to fulfill its purpose and will not survive until the GC cycle begins. During a collector’s first two generations, these short-lived objects will be moved to the long-lived region and then die almost immediately until the next collection is complete. This seems rather wasteful since these are much less frequent (and usually much more expensive).
This can be mitigated by HotSpot’s survivor space, where objects from previous collections of young objects are stored. The evacuating collector copies surviving objects between survivor spaces until a _tenuring threshold is reached, at which point the object is promoted to the old generation.
Heap of HotSpots
As well as an interpreter, a just-in-time compiler, and a memory management subsystem for user space, HotSpot JVM is a relatively complex piece of code. There is a combination of C, C++, and a significant amount of assembly code specific to each platform.
Here are some highlights of our description of the HotSpot heap. During JVM startup, the heap is reserved, but only parts of it are initially allocated to the various memory pools. A memory pool is resized according to the needs of the application while it is running. The GC subsystem performs these resizes.
OBJECTS IN THE HEAP
Application threads create objects in Eden, and a non-deterministic garbage collection cycle removes them. If memory gets low, the GC cycle runs. There are two generations in the heap, young and old. As opposed to the old generation, which consists of only one memory space, the young generation has Eden and survivor spaces.
The old generation is the group of objects that have survived several GC cycles. There are usually very few computation requirements for collections that only collect the young generation. GC performance is improved by HotSpot’s advanced form of mark-and-sweep, which does extra bookkeeping.
It is also important for developers to understand one other terminology distinction when discussing garbage collectors:
Parallel collector
Collectors working in parallelr that uses multiple threads to perform collection
Concurrent collector
Collecting concurrentlythat can run at the same time as application threads are still running
We have implicitly discussed parallel, not concurrent, collection algorithms in our discussion so far.
Furthermore, the heap has a simple structure in Java version 8 and below: every memory pool (Eden, survivor spaces, and tenured) is a single contiguous block. These older versions come with a collector called Parallel by default. The default collection algorithm for Java 9 is G1.
A new garbage collector called Garbage First (G1) was developed for Java 7 (with some preliminary work done for Java 6). From Java 9 onwards, it is the default (although other collectors remain available as alternatives) and officially fully supported since Java 8 Update 40.
The region-based collector G1 has a different heap layout. An object belongs to the same memory pool in a region (usually 1MB in size, but larger heaps may have regions of 2, 4, 8, 16, or 32MB). The regions that comprise a pool of a regional collector, however, may not always be located in memory next to each other. While the whole heap remains contiguous in both cases, the Java 8 heap has contiguous pools.
Due to their excellent recovery of free memory, G1 focuses on garbage-filled regions. The collector evacuates individual regions incrementally when evacuating.
With G1, the user can specify how long and how often to pause when doing GC, taking over from CMS, the previous low-pause collector.
It is possible to control how long the collector pauses by using the -XX:MaxGCPauseMillis=200 command-line switch. You can change this value based on your needs since the default pause time goal is 200ms.
As far as the collector can be pushed, there are, of course, limits. Java’s garbage collection is governed by the rate at which new memory is allocated, which can vary greatly from application to application. A pause time under 100ms is hard to achieve reliably with G1 due to this limitation.
A replacement low-pause collector was the original intent of G1. Although its overall behavior has enabled it to become more general-purpose (which is why it has now become the default collection method).
New production-grade collectors are not developed quickly and are not suitable for general use. We will discuss the alternative collectors provided by HotSpot (including Java 8’s parallel collector) in the next section.
ParallelOld
Java 8 defaults to a parallel (but not concurrent) mark-and-sweep collector for the old generation. A first glance would suggest it is similar to the collector used for the young generation. In one very important respect, it differs from an evacuating collector: it does not evacuate. Rather than compacting the old generation, the collection compacts the new generation. Over time, this prevents the memory space from becoming fragmented.
In modern applications, ParallelOld is less desirable due to two properties. This is what it is:
Fully STW
A linear relationship exists between heap size and pause time
Thus, once GC starts, it must be allowed to finish and cannot be aborted. Increasing heap sizes decrease ParallelOld’s appeal as compared to G1, which can maintain a constant pause time regardless of heap size (assuming that the allocation rate is manageable).
In many cases, G1 will perform better than ParallelOld for a large majority of applications that previously used ParallelOld. ParallelOld is still available as of Java 11, for those apps that still need it (hopefully few). However, G1 should be used wherever possible in the future.
Concurrent Mark-and-Sweep
Concurrent Mark-and-Sweep (CMS) is the most widely used alternate collector in HotSpot. The old generation is collected with this collector, while the young generation is collected with a parallel collector.
It is often difficult to tune CMS effectively because it is a complex collector. The tool can be a valuable addition to a developer’s arsenal, but shouldn’t be used lightly or blindly. This article does not discuss CMS in detail, but there are several basic properties you should know about. A reader with an interest in GC performance should consult specialist blogs and mailing lists (e.g., the “Friends of jClarity” list).
The CMS only collects data from older generations.
Most of the GC cycle is conducted alongside application threads, reducing the amount of pauses.
It takes less time for application threads to stop.
STW pause times are minimized through six phases.
The main STW pause is replaced by two (usually very brief) STW pauses.
In addition, it requires much more CPU time and bookkeeping.
It takes much longer for GC cycles to complete.
Concurrently running GC uses half of the CPUs by default.
Except for low-pause applications, it should not be used.
There is no reason to use it for high-throughput applications.
The default (parallel) collector will be used in cases of high fragmentation if the collector does not compact.
The Serial (and SerialOld) collectors and the incremental CMS collector are also deprecated and should not be used in Hotspot.
The final step
The developer should be aware of an old resource management technique called finalization. This technique, however, is extremely deprecated, and Java developers should avoid using it directly.
Once resources are no longer needed, the finalization mechanism automatically releases them. Objects can hold other kinds of resources, such as open files and network connections, which are automatically freed by garbage collection. These additional resources cannot be freed by the garbage collector, so the finalization mechanism allows the developer to perform cleanup tasks such as closing files, terminating network connections, and deleting temporary files.
Objects with finalize() methods are invoked some time after they become unused (or unreachable) but before they are reclaimed by the garbage collector. When an object is finalized, its resources are cleaned up.
The technique used in Oracle/OpenJDK is as follows:
An object that is no longer reachable is marked and considered live for GC purposes when it is placed on the internal finalization queue.
Invoking finalize() methods on each object in the finalization queue removes them one by one.
The object is not immediately freed after a finalizer is invoked. By storing the this reference somewhere (e.g., in a public static field of a class), a finalizer method could resurrect the object.
It is therefore necessary for the garbage collection system to redetermine that the object is unreachable after finalize() has been called.
Despite this, the finalizer method is never called twice even if an object is resurrected.
As a result, objects with a finalize() will usually last (at least) one extra GC cycle (and if they’re long-lived, one extra GC cycle).
There is a central problem with finalization in that Java does not guarantee when or in what order garbage collection will occur. It is therefore impossible for the platform to guarantee when (or even if) finalizers will be invoked or what order they will be invoked.
Details of the finalization
We provide some additional details and caveats for the few use cases where finalization is appropriate:
It is possible for the JVM to exit without garbage collecting all outstanding objects, so some finalizers may not be invoked. During this process, the operating system closes network connections and reclaims them. Although the operating system will not delete a file if a finalizer that deletes it does not run, it will also not destroy it.
Java has Runtime::addShutdownHook that can safely execute arbitrary code before the JVM exits, ensuring certain actions are taken before the VM exits.
Finalizers function on instances, and the finalize() method is an instance method. A class cannot be finalized in the same way.
Finalizers are instance methods that return no value and do not take any arguments. The finalizer for a class must be named finalize(), and there can be only one finalizer per class.
Exceptions and errors can be thrown by a finalizer, but when the garbage collection subsystem automatically invokes a finalizer, any exception or error it throws is ignored and will only return the finalizer method.
In other languages and environments, the concept of finalization is similar. An automatic resource management pattern in C++ is called RAII (Resource Acquisition Is Initialization). The programmer provides the destructor method when the object is destroyed (which is equivalent to finalize() in Java).
In a nutshell, when an object is created, it takes ownership of some resources, and that ownership is tied to the object’s lifetime. Without any programming intervention, the platform calls the destructor when the object dies, thereby relinquishing ownership of the resource.
In reality, finalization differs fundamentally from this mechanism despite being superficially similar. Due to Java’s different memory management scheme than C++’s, the finalization language feature is fatally flawed.
Object lifetimes are explicitly managed by the programmer in C++. Destructors can be called immediately after an object is deleted (the platform guarantees this), so resources are acquired and released directly as they are needed.
By contrast, Java’s memory management subsystem is a garbage collector that runs as needed when memory becomes unavailable for allocation. Thus, finalize() is called only when the object is collected, and this time will be unknown since it runs at variable (and nondeterministic) intervals.
There is no guarantee that resources (e.g., filehandles) will be released (if ever) if the finalize() mechanism was used. The finalization mechanism is therefore fundamentally unsuitable for its stated purpose — automating resource management. In order to avoid running out of resources, we cannot guarantee that finalization will occur quickly enough.
Finalizers are only useful for classes with native methods, which hold open non-Java resources. It is preferable to use try-with-resources here, though it can also be useful to declare a public native finalize() method (which would be called by close()); in this way, native resources, including off-heap memory that is not controlled by Java’s garbage collector, would be released. A programmers failure to call close() would result in the finalization mechanism acting as a “Hail Mary” protection. In spite of this, TWR supports block structure automatically and provides a better mechanism.
Concurrency in Java
Threads serve as lightweight execution units that are smaller than processes while still capable of executing arbitrary Java code. Threads usually belong to processes, with the address space of the process shared by all threads within that process, so that each thread is a fully fledged unit of execution to the operating system. Threads can be scheduled independently and have their own stacks and program counters, but share memory and objects with other threads.
From the very first version of the Java platform, multithreaded programming has been supported. New threads of execution can be created by the developer using the platform.
The first step toward understanding this is examining what happens when the original application thread (often called the main thread) appears once a Java program starts up:
Java Main is executed by the programmer.
All Java programs run inside the Java Virtual Machine, which starts up when the Java Virtual Machine is started.
Upon examining its arguments, the JVM finds that the programmer requested execution to begin with Main.class’s main() method.
A dedicated thread (main thread) is started for the execution of the program if Main passes classloading checks.
Main thread starts JVM bytecode interpreter.
One bytecode at a time is read by the interpreter of Main::main(), and execution begins.
Java programs always start this way, but this also means:
The Java program starts as part of a managed model with one thread per interpreter.
Java applications can be controlled by the JVM in some way.
In Java code, threads of execution are usually created by the following method:
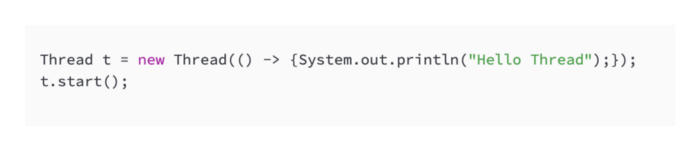
It creates and starts a new thread, which executes the lambda expression’s body and subsequently executes the lambda expression’s body.
Threading allows new threads to execute in parallel with threads created by the JVM and the original application thread.
The operating system creates a new OS thread every time we call Thread::start() in mainstream Java implementations. As a result of this new OS thread executing exec(), a new JVM bytecode interpreter is created. Run() (or, equivalently, the body of the lambda) is where the interpreter executes.
An application thread’s access to the CPU is controlled by the operating system scheduler, which is a built-in component of the operating system that is responsible for managing processor time slices (and that prevents application threads from exceeding their allocations).
Recent Java versions have increasingly emphasized runtime-managed concurrency. The idea is that developers shouldn’t explicitly manage threads for many purposes. The runtime should instead provide “fire and forget” capabilities, so that programs specify what needs to be accomplished, but leave the low-level details to the runtime.
Throughout this article, we will cover the Java platform’s low-level concurrency mechanisms, which are essential for Java developers.
Thread Lifecycle
Taking a look at a thread’s lifecycle will help us understand how it works. Threads are viewed differently by every operating system (although they are generally similar at a high level). An enum called Thread.State wraps the operating system’s view of the thread’s state, so Java abstracts those details away. A thread’s lifecycle can be seen through the values of Thread.State:
NEW
There is a thread in existence, but it hasn’t yet been started by calling its start() method. In this state, all threads begin.
RUNNABLE
Operating systems schedule threads to run when they are available.
BLOCKED
Because the thread is still awaiting a lock, it cannot enter synchronized methods or blocks. Later in this section, we will discuss synchronized methods and blocks.
WAITING
There is no thread running because it called Object.wait() or Thread.join().
TIMED_WAITING
Thread.sleep() or Object.wait() or Thread.join() have been called with a timeout value, which prevents the thread from running.
TERMINATED
Execution of the thread has been completed. There was an exception thrown by its run() method or it exited normally.
Among mainstream operating systems, these states represent a common view of threads, as shown in Figure 4.
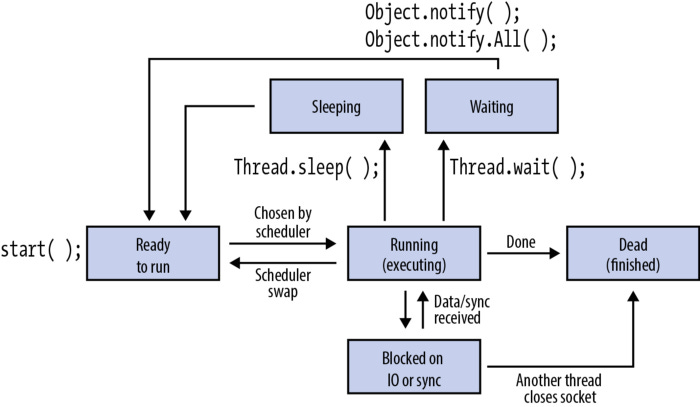
Figure 4. Thread lifecycle
With the Thread.sleep() method, threads can also be put to sleep. The thread wants to sleep for a specified amount of time in milliseconds, like this:
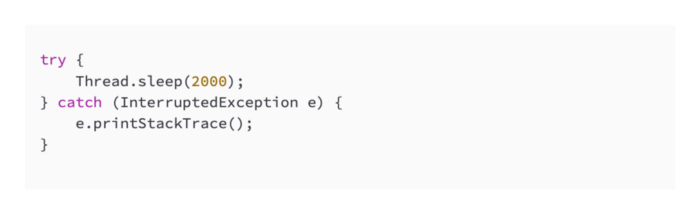
In this article we will go into more detail about Thread’s other methods, but first we need to take a look at some essential theory related to threads and memory access, which is a fundamental part of understanding why multithreaded programming can be difficult for developers.
Mutability and visibility
Mainstream Java implementations provide threads with separate call stacks (and local variables), but the heap is shared across all threads. Objects can be shared between threads very easily since all that needs to be done is pass a reference between them. As shown in Figure 5, this is the case.
Java’s default design principle is to display objects by default. I can copy and pass an object to another thread if I have a reference to it. Since Java references are essentially typed pointers, it makes sense that they would be visible by default since threads share the same address space.
Object instances of Java are mutable by default, which is another property important to understanding concurrency, alongside being visible by default. A variable or reference can be made constant by using the final keyword, but its contents are not affected.
Concurrent Java programs, as we will see in the remainder of this article, are complicated by both visibility across threads and mutability of objects.

Figure 5. Shared memory between threads