


Magic Of Deep Learning: A Journey Through Neural Network
Magic Of Deep Learning: A Journey Through Neural Network
From Basic concept to building a neural network for MNIST classification

Having previously observed the process of training different models, let's now explore the inner workings in more detail. In this exploration, we will begin by exploring computer vision to introduce fundamental tools and concepts necessary for deep learning.
We will explore the workings of arrays and tensors, and delve into the concept of broadcasting, a highly effective technique. Stochastic gradient descent (SGD), the method for automated weight updates, will also be covered. During a core classification job, we will deliberate on the choice of a loss function and the significance of mini-batches. Furthermore, we will describe the mathematical operations carried out by a basic neural network. Ultimately, all these components will be integrated harmoniously.
Future articles will explore various applications in more detail and in different contexts. This article, however, is concentrating on laying the foundation. To be truthful, this article is one of the most challenging, as these concepts are interconnected. Similar to an arch, all foundational elements must be meticulously arranged if the structure is to remain stable. 'Like an arch, once these components are assembled, they create a strong and resilient framework that can uphold additional elements.' However, building this framework requires patience.
Let's begin. The first step requires understanding how images are encoded in a computer system.
Computer Vision Elements: Pixels
Comprehending how a computer vision model works necessitates an understanding of the process by which computers interpret images. For our research project, we will be using the well-known MNIST dataset, which consists of handwritten images of digits. Yann LeCun and his team compiled these images into a machine learning dataset after gathering them by the National Institute of Standards and Technology. In 1998, LeCun incorporated MNIST into LeNet-5, creating the initial computer system capable of effectively recognizing handwritten digits. This represented an important milestone in the field of artificial intelligence.
Acquiring profound knowledge and persistence.
This small group was dedicated to deep learning and persevered in their research efforts. At first greeted with high expectations (and the subsequent hype!) During the 1990s and 2000s, neural networks were not widely employed. Despite the shift, some researchers continued their efforts to improve their performance. Yann Lecun, Yoshua Bengio, and Geoffrey Hinton were honored with the prestigious Turing Award in 2018. The scepticism and lack of interest from the broader machine learning and statistics community could not deter them from achieving this prestigious award, often referred to as the "Nobel Prize of computer science".
Hinton has recounted experiences of academic papers being turned down by renowned journals and conferences simply because they used a neural network, despite the fact that they presented substantially superior outcomes compared to anything previously published. In the following section, we will investigate Lecun's research on convolutional neural networks, which illustrated the unprecedented ability of these models to recognize handwritten text—a capability that was previously impossible. Despite being widely used in commercial applications, Lecun's innovation was largely ignored by the research community.
The three Turing Award recipients mentioned, numerous other researchers have made significant contributions to the advancements in the field. He collaborated with his student Sepp Hochreiter on the development of the long short-term memory (LSTM) architecture, contributions that make him worthy of consideration for the Turing Award. Also of great importance is Paul Werbos' creation of backpropagation for neural networks in 1974, a technique discussed in this article and now commonly used in training neural networks (Werbos 1994). Werbos' innovation, which was overlooked for many years, is now considered a fundamental building block of modern AI.
"Everyone should learn from this!" As you progress in your deep learning journey, you will confront a multitude of challenges - including technical hurdles and the even more formidable obstacles posed by non-believers in your environment. Giving up is a sure path to failure. Every fast.ai student who has achieved greatness as an practitioner possesses a remarkable level of tenacity. This has been noticed as a common occurrence.
During this tutorial's introduction, our main task will be to create a model capable of differentiating between digits 3 and 7 in images. Begin by downloading a sample dataset from MNIST that consists exclusively of images of these two digits.
path = untar_data(URLs.MNIST_SAMPLE)The contents of this directory can be viewed by using the ls command, which was provided by fastai. Using the ls method, introduced by fastai, returns an instance of a unique fastai class named L. This class inherits all the core functionalities of Python's native list and offers additional capabilities. One advantage of this class is that it displays the item count when it is printed, before displaying the actual items. If there are more than 10 items, only the first few items will be displayed.
path.ls()
(#9) [Path('cleaned.csv'),Path('item_list.txt'),Path('trained_model.pkl'),Path('
 > models'),Path('valid'),Path('labels.csv'),Path('export.pkl'),Path('history.cs
 > v'),Path('train')]
The MNIST dataset follows a typical structure for machine learning datasets, with separate folders for the training set and the validation set. We'll examine the contents of the training set:
(path/'train').ls()
(#2) [Path('train/7'),Path('train/3')]
In machine learning, we have one folder with images labeled as "3" and another folder with images labeled as "7". These are the classes or labels in this dataset. By using "sorted", we can maintain a consistent order of files for everyone. Let's examine the contents of one of these folders.
threes = (path/'train'/'3').ls().sorted()
sevens = (path/'train'/'7').ls().sorted()
threes
(#6131) [Path('train/3/10.png'),Path('train/3/10000.png'),Path('train/3/10011.pn
 > g'),Path('train/3/10031.png'),Path('train/3/10034.png'),Path('train/3/10042.p
 > ng'),Path('train/3/10052.png'),Path('train/3/1007.png'),Path('train/3/10074.p
 > ng'),Path('train/3/10091.png')...]
As expected, the file is full of image data. Could we explore one? Showcasing a visual representation portraying the handwritten digit 3 retrieved from the widely acclaimed MNIST dataset of handwritten digits.
im3_path = threes[1]
im3 = Image.open(im3_path)
im3
In this particular scenario, we are utilizing the Image class from the Python Imaging Library (PIL), which is a widely used Python package for the manipulation and visualization of images. Our Jupyter environment is equipped to handle PIL images, and will visualize them automatically.
Numerical values represent all data in a computer system. To visualize the numerical representation of an image, it must be transformed into a NumPy array or a PyTorch tensor. The following shows a portion of the image converted into a NumPy array as an example:
array(im3)[4:10,4:10]
array([[  0,   0,   0,   0,   0,   0],
       [  0,   0,   0,   0,   0,  29],
       [  0,   0,   0,  48, 166, 224],
       [  0,  93, 244, 249, 253, 187],
       [  0, 107, 253, 253, 230,  48],
       [  0,   3,  20,  20,  15,   0]], dtype=uint8)
The 4:10 range indicates that rows with indices ranging from 4 (inclusive) to 9 (exclusive) and columns with the same indices were requested. In NumPy, indexing proceeds from the top-left corner of the image, placing this selection in close proximity to the top-left corner. 'Below is the corresponding tensor representation in PyTorch:'
tensor(im3)[4:10,4:10]
tensor([[  0,   0,   0,   0,   0,   0],
        [  0,   0,   0,   0,   0,  29],
        [  0,   0,   0,  48, 166, 224],
        [  0,  93, 244, 249, 253, 187],
        [  0, 107, 253, 253, 230,  48],
        [  0,   3,  20,  20,  15,   0]], dtype=torch.uint8)
We can select only the portion of the array containing the top of the digit by using array slicing. After that, we can use a Pandas DataFrame to apply color-coding to the values using a gradient. This visual representation aids in comprehending how the image is derived from the pixel values.
im3_t = tensor(im3)
df = pd.DataFrame(im3_t[4:15,4:22])
df.style.set_properties(**{'font-size':'6pt'}).background_gradient('Greys')
Shades of gray are represented between 0 and 255, with 0 representing white pixels and 255 representing black pixels. There are 28 pixels wide and 28 pixels tall, making a total of 784 pixels. Compared to images from a phone camera, which typically have many millions of pixels, this size is indeed smaller. For our initial learning and experiments, we find this image size convenient. We will progress to larger, full-color images in the near future.
Having observed how an image appears to a computer, let's remember our objective: to develop a model capable of identifying numbers 3 and 7. Could you share how you would train a computer to accomplish this task?
Initial Attempt: Pixel Similarity
To begin, one could consider calculating the average of every pixel across all images of the number three, as well as the average of every pixel across all images of the number seven. By employing this process, we will acquire group averages, allowing us to identify what we commonly refer to as the "ideal" representations of 3 and 7. By comparing an image with these ideal representations, we can categorize it as a 3 or a 7 based on which it resembles more. Although this approach may not be perfect, it serves as a strong starting point for our analysis.
Calculating the average of pixel values for each group is the first step of our basic model. You will come across some interesting Python numeric programming techniques during this procedure.
We will stack all the 3s on top of each other to form a tensor. "We have experience creating a tensor for an image." We will generate a tensor for each image in a directory using a Python list comprehension.
We will utilize Jupyter to perform quick checks on our work progress, such as verifying that the number of items returned appears reasonable.
seven_tensors = [tensor(Image.open(o)) for o in sevens]
three_tensors = [tensor(Image.open(o)) for o in threes]
len(three_tensors),len(seven_tensors)
(6131, 6265)We will also check to make sure that one of the images appears acceptable. Since we are currently using tensors instead of PIL images, which Jupyter will display as images by default, we must use fastai's show_image function to display them.
show_image(three_tensors[1]);
The average intensity of each pixel position across all images is what we are aiming to determine. All pictures are consolidated into a three-dimensional array, often referred to as a rank-3 tensor. When dealing with multiple tensors in a group, it is typical to combine them into a single tensor. PyTorch offers a convenient function called stack for this purpose.
In PyTorch, operations like calculating a mean require converting integer types to float types. To prepare, we will convert our stacked tensor to float immediately. PyTorch's casting process is uncomplicated – you specify the desired type, and it's treated as a function call.
In most instances involving floating-point images, the pixel values are generally anticipated to be within the range of 0 to 1. Consequently, we will also divide by 255 in this case.
stacked_sevens = torch.stack(seven_tensors).float()/255
stacked_threes = torch.stack(three_tensors).float()/255
stacked_threes.shape
torch.Size([6131, 28, 28])
A tensor's shape is a crucial characteristic, denoting the dimensions of each axis. In this specific case, for instance, we're utilizing a tensor that consists of 6,131 images, each measuring 28 by 28 pixels. The user determines the number of images, height, and width when constructing the tensor, and it is arbitrary. In PyTorch, a tensor is used to represent numerical data stored in memory.
A tensor's rank is determined by the length of its dimensions.
len(stacked_threes.shape)3In tensor language, the rank refers to the number of axes or dimensions in a tensor, while the shape denotes the size of each axis.
Besides using ndim, you can also determine the rank of a tensor directly.
stacked_threes.ndim
3
Finally, we can determine the characteristics of the perfect 3. The mean across dimension 0 of our assembled rank-3 tensor is computed to find the average of all image tensors. All pictures are indexed by this dimension.
This process calculates the average pixel value across all images for each pixel. Each pixel in the image corresponds to a single value.
mean3 = stacked_threes.mean(0)
show_image(mean3);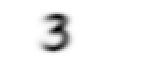
According to the data, this is the optimal number three! (You might not agree, but this is number 3's peak performance). In agreement with the alignment, the images depict a consistent dark shade, whereas in disagreement with the alignment, the images appear faint and blurry.
We will now consolidate all the steps for the 7s, streamlining the process for greater efficiency.
mean7 = stacked_sevens.mean(0)
show_image(mean7);
Calculate the distance between the random number 3 and our "ideal numbers."
Example 3:
a_3 = stacked_threes[1]
show_image(a_3);
What is the method for measuring the distance from our desired "ideal 3"? Merely summing up the pixel differences between the image and the ideal digit will not be sufficient. Differences can be both positive and negative, potentially canceling each other out. When an image is excessively dark in one area and too light in another, it may be wrongly interpreted as having zero overall differences from the ideal value. This could be misleading and inaccurate.
In order to prevent this, data scientists utilize two methods to calculate distance in this scenario:
The average of the absolute differences should be calculated, using the absolute value function to turn negative values into positive values. The absolute difference or L1 norm is what is known as the mean absolute difference.
To find the root mean squared error (RMSE) or L2 norm, calculate the mean of the squared differences, ensuring that all values are positive, and then take the square root to undo the squaring process.
How about trying both of these out now?
dist_3_abs = (a_3 - mean3).abs().mean()
dist_3_sqr = ((a_3 - mean3)**2).mean().sqrt()
dist_3_abs,dist_3_sqr
(tensor(0.1114), tensor(0.2021))
dist_7_abs = (a_3 - mean7).abs().mean()
dist_7_sqr = ((a_3 - mean7)**2).mean().sqrt()
dist_7_abs,dist_7_sqr
(tensor(0.1586), tensor(0.3021))
In both situations, the difference between our number three and the "ideal" 3 is smaller than the difference between the ideal seven, suggesting that our basic model will accurately predict the outcome.
The torch.nn.functional module contains both of these loss functions, which are offered by PyTorch. The PyTorch team recommends importing this module as F, and it is also readily available under that name in fastai by default.
F.l1_loss(a_3.float(),mean7), F.mse_loss(a_3,mean7).sqrt()
(tensor(0.1586), tensor(0.3021))
MSE represents mean squared error, while l1 represents the standard mathematical terminology for mean absolute value, which is known as the L1 norm in mathematics.
PyTorch tensors were subjected to multiple mathematical operations recently. Those familiar with NumPy and experienced in numeric programming may see resemblances between PyTorch tensors and NumPy arrays. Let us now delve into these two fundamental data structures.
In NumPy and PyTorch, arrays and tensors, respectively
In Python, NumPy is a widely used library for scientific and numeric programming. Although it provides similar functionality and an API to PyTorch, it does not support GPU utilization or gradient calculations, both of which are necessary for deep learning.
Why are arrays and tensors important, and what exactly are they?
Compared to a lot of other languages, Python may be slower. Nevertheless, any performance benefits observed in Python, thanks in part to libraries such as NumPy and PyTorch, are generally attributable to the fact that they wrap compiled objects written in C, which is a quicker language. In particular, NumPy arrays and PyTorch tensors can complete computations significantly faster than pure Python, often by thousands of times.
In NumPy, a multi-dimensional data structure holds elements of the same data type. 'These elements can be of any data type, including arrays of arrays with different lengths for the inner arrays, also known as jagged arrays.' A multi-dimensional table is one that has different levels of abstraction, like a list (1D), matrix (2D), or cube (3D), and so on. NumPy takes advantage of a compact C data structure to store simple element types like integers and floats effectively in memory. 'NumPy shines in this area, providing an extensive array of operators and techniques that operate on these compact structures at speeds comparable to optimized C code, since they are implemented in optimized C.'
A PyTorch tensor bears resemblance to a NumPy array, although it provides extra functionalities. Just like a NumPy array, a tensor is also a multidimensional data table with elements of the same kind. Nevertheless, the crucial distinction lies in that a tensor must be consistent in all the elements' numeric data types. A tensor is less versatile than a true array of arrays since it cannot be composed of arrays of different lengths, making it a fixed and uniformly shaped multidimensional structure.
PyTorch supports most of the methods and operators available in NumPy for these data structures. On the other hand, PyTorch tensors provide additional functionality. One significant benefit of these constructions is their ability to run on the GPU, allowing for optimized computations that can significantly speed up operations, especially when handling large datasets. Additionally, PyTorch can compute derivatives for these complex operations automatically. In deep learning tasks, this essential capability is necessary for practical implementation.
A Python programmer must master the usage of array and tensor APIs in order to acquire one of the most vital skills.
To create an array or tensor, provide a list (or a list of lists, or a list of lists of lists, and so on) as an input.
data = [[1,2,3],[4,5,6]]
arr = array (data)
tns = tensor(data)
arr  # numpy
array([[1, 2, 3],
       [4, 5, 6]])
tns  # pytorch
tensor([[1, 2, 3],
        [4, 5, 6]])
Using tensors, the upcoming operations are shown, but the syntax and outcomes for NumPy arrays are identical.
You have the choice to specify an index number in order to select a particular row (note that, like lists in Python, tensors are 0-indexed, which means that 1 represents the second row/column):
tns[1]
tensor([4, 5, 6])
A column can be represented using a colon to indicate all the values along the first major axis (referred to as dimensions or axes in tensors/arrays).
tns[:,1]
tensor([2, 5])
A row or column can be sliced by using the Python slice syntax ([start:end], where end is excluded).