


Mastercard Stock Price Prediction Using LSTM
Mastercard Stock Price Prediction Using LSTM
In this article i am going to try to predict mastercard stock price prediction using long short term memory.

Imports
import numpy as np # linear algebra
import pandas as pd # data processing, CSV file I/O (e.g. pd.read_csv)
import matplotlib.pyplot as plt
from sklearn.preprocessing import MinMaxScaler
from keras.models import Sequential
from keras.layers import Dense, LSTM, Dropout, GRU, Bidirectional
from tensorflow.keras import layers, callbacks

import os
for dirname, _, filenames in os.walk('/kaggle/input'):
    for filename in filenames:
        print(os.path.join(dirname, filename))
This code first imports the required libraries for data analysis and machine learning such as numpy, pandas, and keras. It then imports specific functions from these libraries that will be used in the code, such as MinMaxScaler for data normalization and layers for model creation. Next, it uses a custom module called callbacks and the os library to handle file paths and walk through directories. The code then prints the file path and name for each file in the specified directory.
df = pd.read_csv('/kaggle/input/mastercard-stock-data-latest-and-updated/Mastercard_stock_history.csv')This code reads in a CSV file containing data on Mastercard stock history and assigns it to a variable called df. The data is stored in a tabular format and can be accessed and manipulated through the use of a library called pandas which is abbreviated as pd in this code. The read_csv function is used to read in the data from the CSV file and the file path for the CSV file is specified within the parentheses. In this case, the file path is /kaggle/input/mastercard-stock-data-latest-and-updated/Mastercard_stock_history.csv.
Preprocessing
df.head()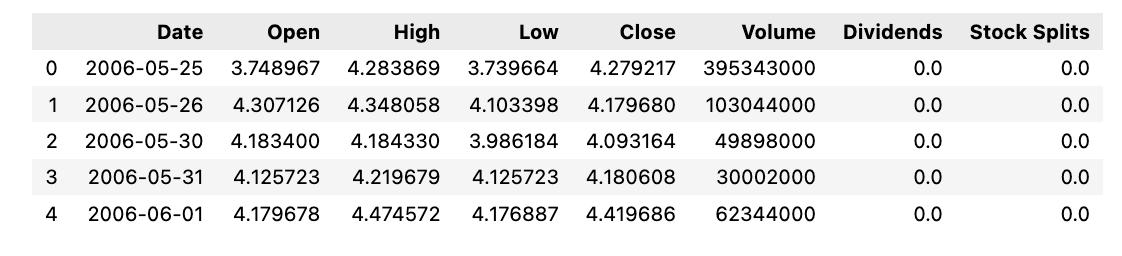
The code, df.head, is used to preview or show the first five rows of the data frame, df. This gives a quick overview of the data and allows for a better understanding of its structure and content. Additionally, it helps identify any potential errors or missing values in the data. This code is commonly used in data analysis and helps researchers and analysts to get a sense of the data before further analysis.
df.index = pd.to_datetime(df['Date'])
df.drop(columns=['Date'], inplace=True)
This code assigns the dataframes index to the date column, and converts the date column to datetime format using the pandas to_datetime function. Then, it drops the date column from the dataframe using the inplace parameter to modify the dataframe in place instead of creating a copy. Essentially, it is reformatting the dataframes data and removing unnecessary columns to make it more efficient for further analysis and manipulation.