


Mastering Market Trends: The Flag Pattern Trading Strategy
A Data-Driven Approach to Outperform Benchmarks with Risk-Managed Profitability

Predicting stock market trends has always been essential for both individual investors and financial institutions. For individuals, accurate predictions can mean the difference between significant financial gains and substantial losses, impacting personal wealth and financial security. Financial institutions, such as hedge funds, investment banks, and asset management firms, rely on complex prediction models to guide trading decisions, manage portfolios, and maximize client returns. Accurately forecasting market trends and prices not only boosts profitability but also provides a competitive edge in the highly volatile financial markets.
Stock market prediction methods are generally categorized into fundamental analysis and technical analysis. Fundamental analysis involves assessing a company’s true value by reviewing various economic, financial, and other qualitative and quantitative factors. This method includes examining financial reports, management performance, industry trends, and economic conditions to decide if a stock is undervalued or overvalued. The premise is that market prices will eventually reflect the true value of a stock, allowing investors to make decisions based on long-term growth.
In contrast, technical analysis focuses on analyzing statistical trends from trading data, such as price movements and trading volume. Technical analysts use historical charts and indicators to identify patterns that may predict future price behavior. This approach assumes that all available fundamental data is already reflected in stock prices and that price patterns follow trends that can be exploited for profit. Technical analysis is often used for short-term trading, appealing to those looking to capitalize on market movements over shorter periods.

Efficient Market Hypothesis (EMH)
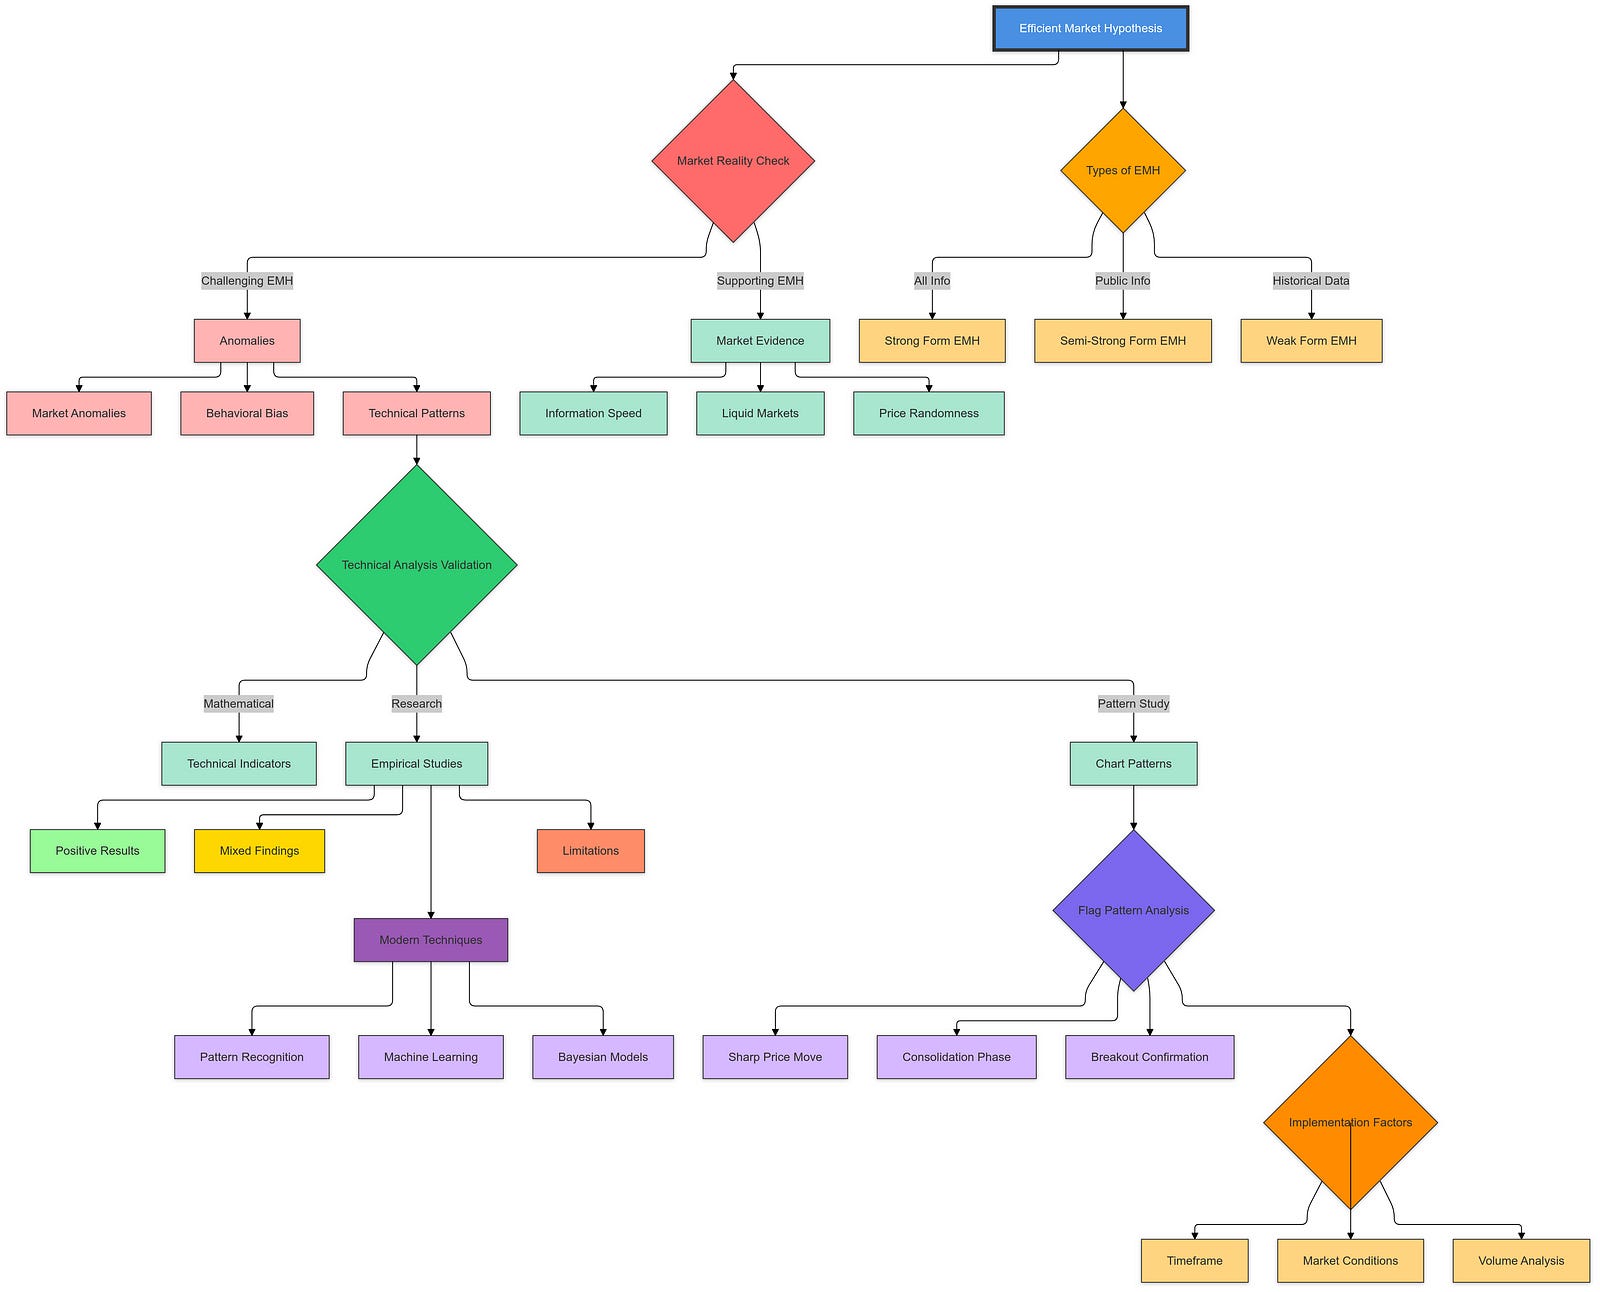
The Efficient Market Hypothesis (EMH) is central to the debate between fundamental and technical analysis. Proposed by economist Eugene Fama in the 1970s, EMH suggests that financial markets are “informationally efficient,” meaning that asset prices always reflect all available information. According to EMH, it is impossible to consistently achieve higher-than-average returns on a risk-adjusted basis, as any new information that could affect stock prices is immediately and accurately reflected in current prices.
EMH is divided into three forms based on the type of information it considers:
Weak Form EMH: States that all past trading information is already reflected in stock prices, implying that technical analysis cannot consistently result in superior returns. Semi-Strong Form EMH: Suggests that all publicly available information is embedded in stock prices, making both fundamental and technical analysis ineffective for outperforming the market. Strong Form EMH: Argues that all information, both public and private, is accounted for in stock prices, making it impossible for any investor to achieve higher gains. The implications of EMH are significant, challenging the basis of active trading strategies. If markets are efficient, consistently outperforming the market through stock picking or timing is theoretically impossible, supporting the idea that passive investing, such as through index funds, is the most reliable way to achieve market-average returns.
EMH has faced extensive criticism and empirical challenges over time. Many studies have shown market anomalies and instances where market behavior deviates from EMH predictions. Examples include momentum (stocks that performed well in the past continuing to do well in the short term) and reversal (stocks tending to revert to average performance over time), both of which challenge the weak form of EMH. Behavioral finance has also introduced ideas around investor psychology and irrational behaviors, questioning the assumption that market participants are always fully rational.
Technical Analysis and Pattern Recognition
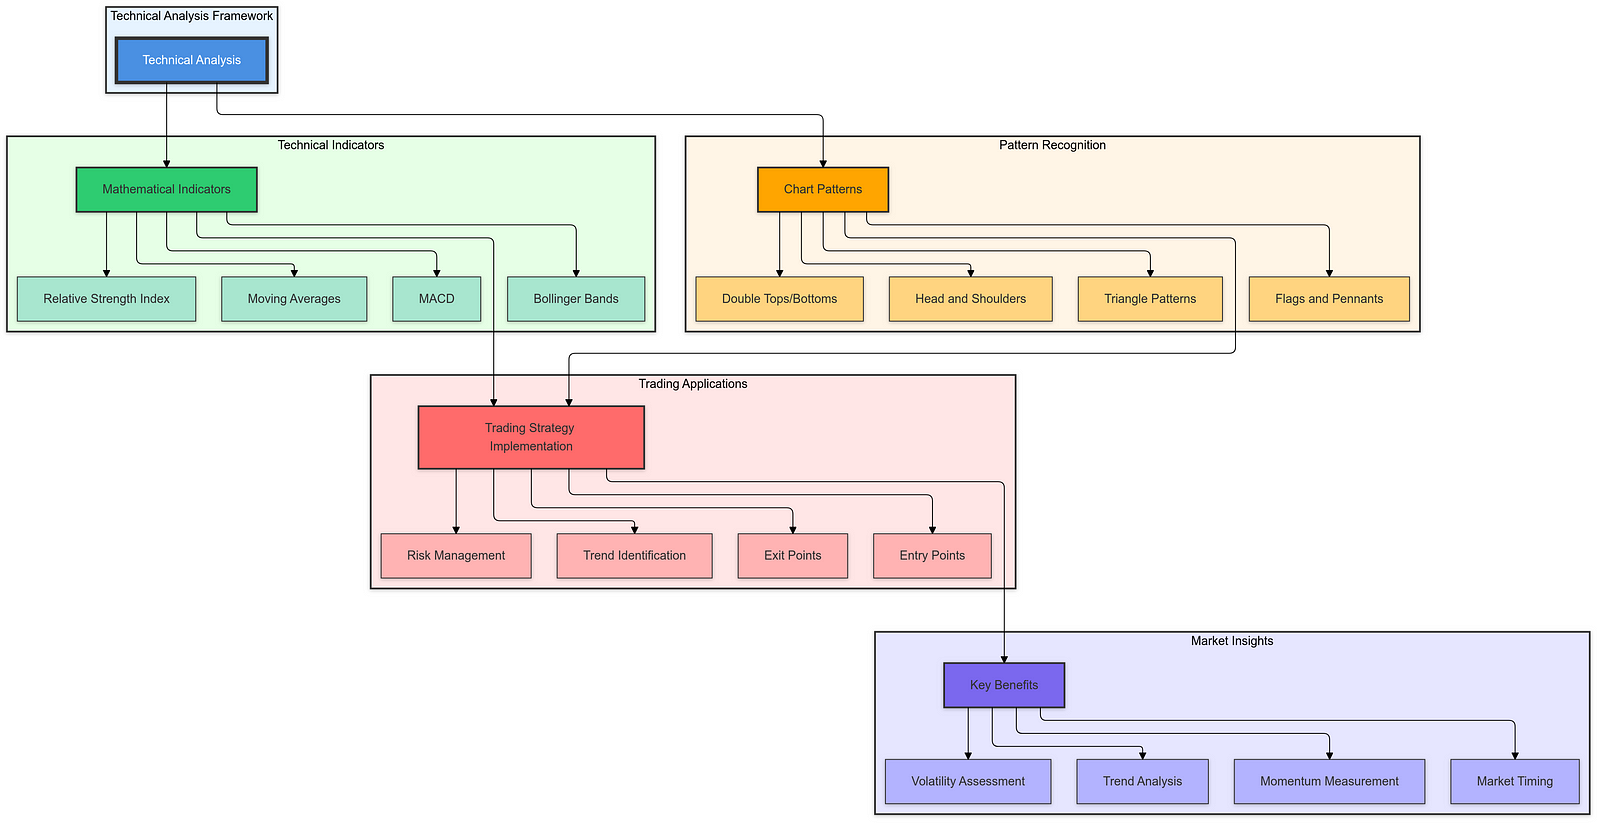
Despite EMH theories, technical analysis continues to be widely used by traders and investors. Its main focus is identifying chart patterns and technical indicators that point to trading opportunities. By reviewing historical price data, technical analysts aim to predict future price movements and make trading decisions based on these predictions.
Pattern recognition is key to technical analysis, with specific formations on price charts viewed as indicators of future market behavior. Common patterns include head and shoulders, double tops and bottoms, triangles, and flags and pennants. These patterns are thought to represent the collective mindset of market participants, signaling changes in supply and demand before price shifts occur.
Technical indicators are mathematical formulas derived from price and volume data, offering additional insights. Indicators like Moving Averages (MA), Relative Strength Index (RSI), Moving Average Convergence Divergence (MACD), and Bollinger Bands help identify trends, measure momentum, assess volatility, and signal overbought or oversold conditions. By combining pattern recognition and technical indicators, traders build comprehensive strategies for precise entry and exit points.
Technical analysis plays a significant role in identifying trading opportunities, with its use of historical price data to forecast future movements. Supporters argue that certain patterns and indicators reliably signal major price changes, allowing traders to profit from these trends. This method is especially effective in highly liquid markets where price data is abundant.
The Flag Pattern as a Technical Indicator
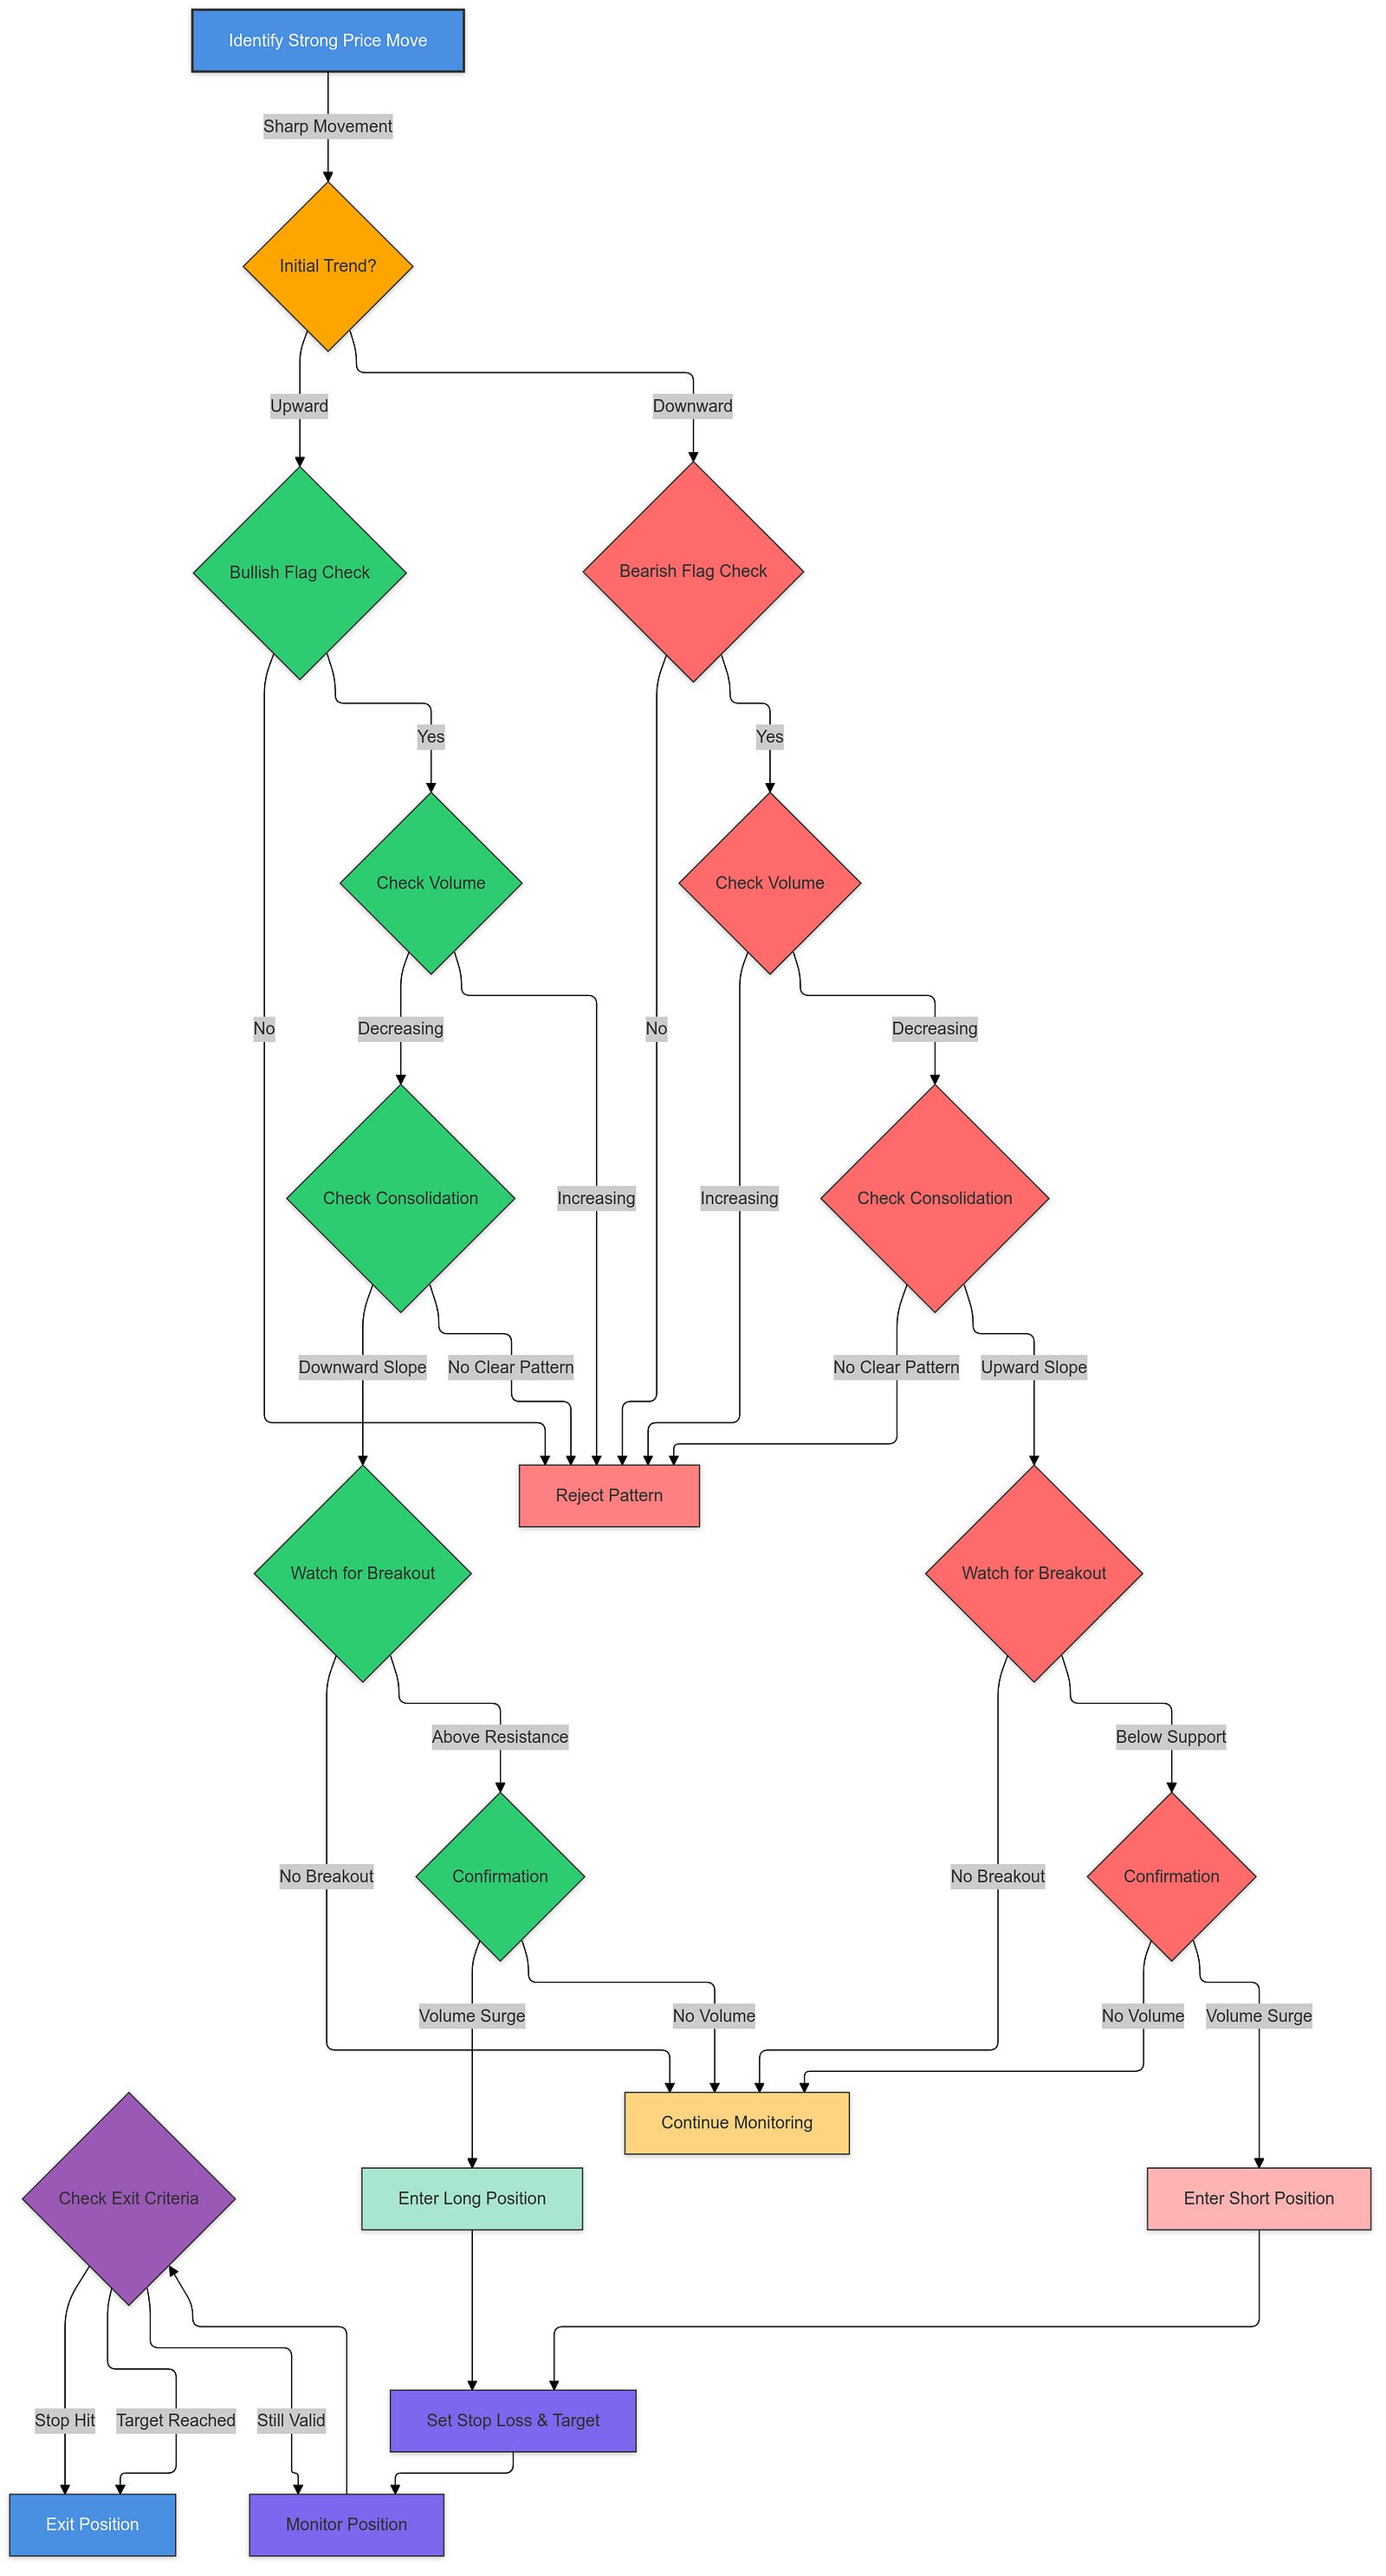
Among the many chart patterns used in technical analysis, the flag pattern is known for its simplicity and effectiveness. The flag pattern starts with a sharp price move called the flagpole, followed by a consolidation phase where prices move within a narrow range, forming the flag. The flag often slopes against the prevailing trend, creating a parallelogram-like shape on the chart. The flag pattern can be bullish or bearish, based on the initial price movement.
A bullish flag pattern appears after a strong upward price movement, with a subsequent downward-sloping consolidation that indicates a temporary pause before the uptrend resumes. Traders see a breakout above the upper boundary of the flag as a buy signal. A bearish flag pattern follows a significant downward price move, with the consolidation phase trending upward, signaling a pause before the downtrend continues. A breakout below the lower boundary suggests a sell signal.
The flag pattern is popular due to its reliability in predicting trend continuations. Studies and trading experiences show that flag patterns often precede major price movements, giving traders actionable insights. Its effectiveness comes from capturing market indecision followed by a return to the trend, providing clear trade entry and exit points.
The flag pattern is also adaptable across different timeframes, from intraday to daily and weekly charts, making it a versatile tool. Its clear visual structure and logical progression from consolidation to breakout align well with traders’ intuitive decision-making, contributing to its widespread use in trading strategies based on technical analysis.
Objective of the Article
This article aims to develop and test a trading strategy centered on the flag pattern using high-frequency intraday data. The goal is to analyze the pattern’s effectiveness in predicting profitable trades within short timeframes. The strategy will focus on accurately identifying flag patterns and incorporating risk management techniques to enhance returns and minimize losses.
Specifically, the article aims to:
Develop a trading rule based on the flag pattern using intraday data for precise identification, creating a reliable basis for trades. Evaluate the profitability and risk-adjusted returns, measuring performance through metrics like total returns, average returns per trade, hit ratios, and maximum drawdowns, ensuring the strategy not only generates profit but does so with manageable risk. Provide comprehensive insights by expanding existing studies, analyzing extensive data, exploring multiple configuration parameters, and testing the strategy across various market conditions and indices. This broad approach seeks to show the strategy’s robustness and practical use for both individual and institutional traders. Through this research, the article contributes to discussions on market efficiency and the practical application of technical analysis. By demonstrating how pattern recognition combined with high-frequency data can be effective, the study aims to provide traders with data-driven strategies that challenge current market theories and support informed decision-making.
Efficient Market Hypothesis and Its Critiques
The Efficient Market Hypothesis (EMH), introduced by Eugene Fama in the 1970s, states that financial markets are “informationally efficient,” meaning asset prices always reflect all available information. This implies that investors cannot consistently achieve returns above the market average through stock selection or timing. Fama categorized EMH into three forms: weak, semi-strong, and strong. The weak form suggests that past trading data is already reflected in current prices, the semi-strong form claims that all public information is embedded, and the strong form argues that even private or insider information is priced in.
EMH has been debated extensively regarding its relevance to real-world markets. Critics argue that markets display anomalies, like momentum and reversal patterns, and behavioral biases that indicate prices do not always accurately reflect information. Behavioral economists such as Daniel Kahneman and Richard Thaler have shown how psychological factors impact investor behavior, causing systematic deviations from market efficiency. Empirical research has mixed findings: some studies support EMH, especially in liquid and developed markets, while others find persistent inefficiencies that allow for excess returns. Anomalies such as the January effect challenge EMH by showing predictable patterns in stock prices, contradicting the hypothesis of random price movements.
Technical Analysis in Challenging EMH
Technical analysis stands as a challenge to EMH by using historical price and volume data to identify patterns that can predict future price changes. Studies have assessed the effectiveness of various technical indicators, such as moving averages, Relative Strength Index (RSI), and Moving Average Convergence Divergence (MACD), in generating returns above the market average.
The results of these studies vary. Some indicate significant abnormal returns, suggesting that certain technical indicators can effectively signal buy and sell opportunities. For example, Jegadeesh and Titman (1993) found momentum strategies, which involve buying stocks with strong past performance and selling those with weaker returns, to yield positive excess returns over intermediate periods. Other research highlights the limitations of technical analysis, pointing out issues like overfitting, high transaction costs, and the adaptive nature of markets that reduce the effectiveness of strategies over time. Modern approaches, such as the use of Bayesian models and machine learning, aim to improve predictive accuracy and overcome the traditional limits of technical analysis.
Flag Pattern in Technical Analysis
The flag pattern is one of the popular chart patterns used in technical analysis due to its simplicity and predictive capability. This pattern consists of a sharp price movement called the flagpole, followed by a period of consolidation forming the flag, suggesting a continuation of the initial trend. Depending on the initial price movement, flag patterns can be bullish or bearish.
Research on flag patterns has confirmed their effectiveness in predicting price movements. Various studies have employed different methods, such as pattern recognition algorithms and machine learning, to identify flag patterns with varying success rates. For example, studies by Leigh et al. (2002) and Wang and Chan (2007, 2009) reported successful use of flag pattern-based strategies across different stock indexes, highlighting the need for precise pattern identification and well-structured trading rules to harness the continuation of trends.
The effectiveness of flag patterns can vary based on definitions and factors such as timeframes, consolidation slope, and the price range during formation. Dynamic definitions that adjust to market conditions have been suggested to enhance the pattern’s applicability across various assets and periods. Adding volume analysis to price patterns is also recommended to confirm flag patterns and improve trade success rates.
Intraday Data vs. Daily Data in Trading Strategies
Choosing between intraday and daily data is crucial in developing trading strategies. Intraday data offers detailed price and volume information throughout the trading day, providing more observations for analysis, which increases statistical power and reduces the chance of misleading results. It also captures short-term market behaviors and microstructural elements that daily data might miss, offering a clearer view of price trends.
However, using intraday data has challenges, such as market noise, high data processing demands, and overfitting risks. Intraday data tends to include more random fluctuations that can hide meaningful patterns. The large volume of this data requires effective data management and computational resources. To mitigate overfitting, strategies should include techniques like data smoothing, dimensionality reduction, and cross-validation to ensure robust and applicable outcomes for live trading.
Risk-Adjusted Returns and Performance Metrics
Assessing trading strategies requires considering both returns and associated risks to fully understand performance. Risk-adjusted returns measure how much return is achieved per unit of risk, providing a clearer comparison between strategies and benchmarks. Common performance metrics include:
Total Return (TR): The overall profit a trading strategy generates over a set period. Average Return (AR): The mean profit per trade, showing typical trade performance. Hit Ratio (HR): The percentage of successful trades out of the total executed, indicating how often trades are profitable. Maximum Drawdown (MD): The largest drop from peak to trough in a strategy’s cumulative returns, showing potential risk and loss. These metrics help investors evaluate if a strategy is profitable and manages risk effectively. Metrics such as the Sharpe Ratio and Sortino Ratio can further refine the analysis by factoring in volatility and downside risk, respectively.
Mitigating Data Snooping and Overfitting
Data snooping and overfitting are common issues in developing trading strategies, especially when extensive backtesting is involved. Data snooping occurs when random patterns in historical data are misinterpreted as meaningful, while overfitting happens when a model becomes too closely tailored to historical data, failing to perform on new data.
To counter these issues, several practices are used:
Out-of-Sample Testing: Splitting data into training and testing sets to evaluate performance on new data, offering a realistic measure of predictive power. Cross-Validation: Dividing data into multiple training and testing subsets to validate strategies across different timeframes and reduce overfitting risks. Multiple Configurations and Parameters: Testing strategies with various settings to find those that consistently perform well rather than succeed due to specific quirks in historical data. Walk-Forward Optimization: Regularly updating model parameters with recent data and validating them in subsequent periods to boost adaptability and reliability. By employing these methods, researchers and traders ensure their strategies are not only historically successful but also capable of delivering reliable performance in live trading scenarios.
Methodology
Developing a solid stock market trading strategy requires a detailed methodology that covers pattern definition, data preparation, pattern recognition, trading rules, risk management, performance evaluation, and data validation. This section explains the steps taken to create and test a flag pattern-based trading strategy using intraday data, focusing on profitability and risk-adjusted returns.
Defining the Flag Pattern
Traditional vs. Novel Definitions
The flag pattern is a well-known formation in technical analysis, defined by a sharp price move (flagpole) followed by a period of consolidation or retracement (the flag). Traditionally, this pattern is seen as a parallelogram or rectangle sloping against the trend, signaling a continuation of the trend upon breakout.
Traditional definitions often involve subjective interpretations and fixed thresholds, leading to inconsistent pattern identification. A novel, objective approach has been introduced to counter these limitations and improve consistency and precision.
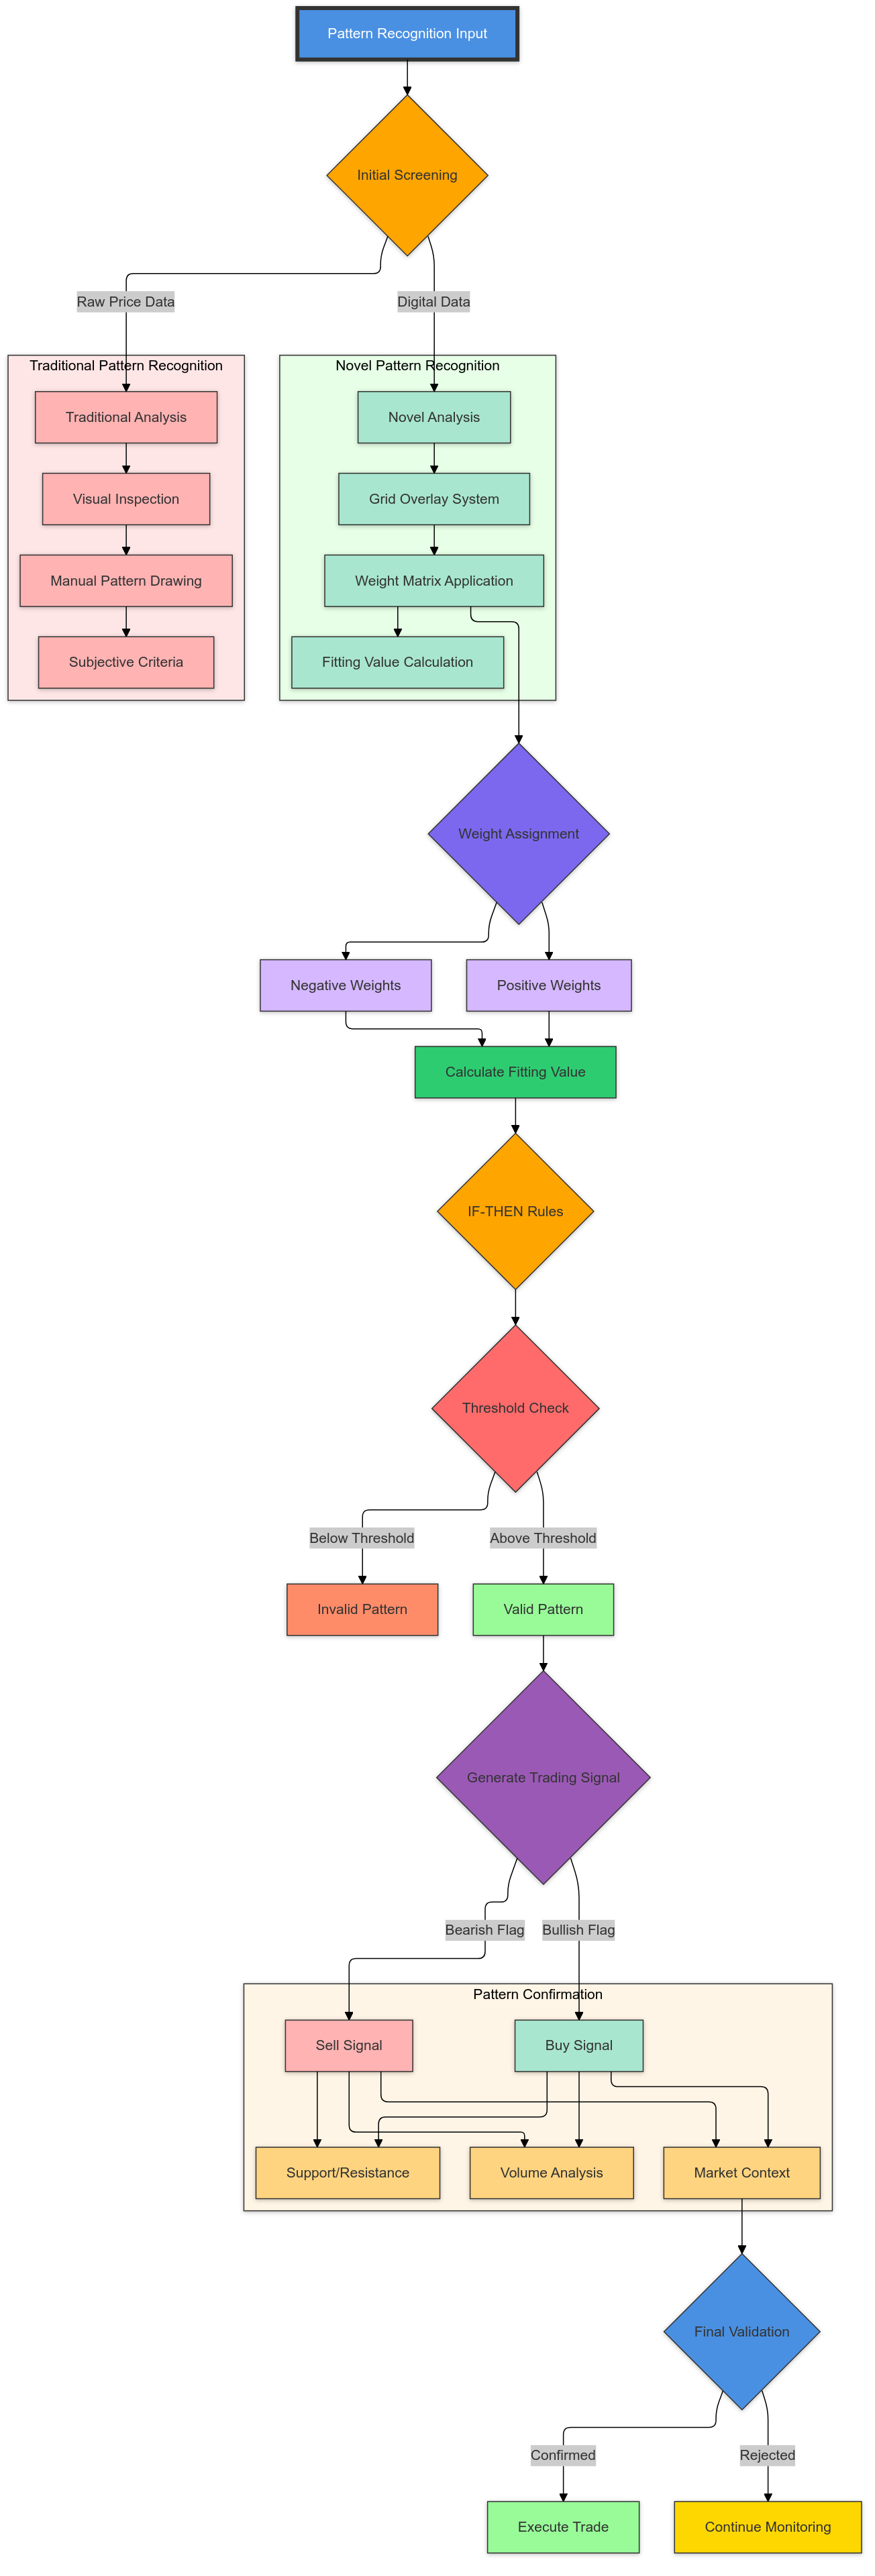
Introduction of a New Weight Matrix for Pattern Recognition
A major innovation in this approach is the weight matrix, which enhances the accuracy of flag pattern recognition. Unlike manual chart reading, this systematic method overlays a grid onto price data and assigns weights to different sections. Positive weights mark areas aligned with the expected pattern, while negative weights mark areas that deviate from it. The fitting value, or the weighted sum of price movements, objectively determines how well a price segment matches the flag pattern.
Alignment with IF-THEN Logical Rules for Decision-Making
The weight matrix complements IF-THEN logical rules, creating clear, objective criteria for trading decisions. For example:
IF the fitting value is above a certain threshold,
THEN trigger a buy (for bullish flags) or sell (for bearish flags).
This method bases trading decisions on quantifiable criteria, improving consistency and reliability.
Data Selection and Preparation
To ensure the strategy’s broad applicability, it is tested on major indexes like the Dow Jones Industrial Average (DJIA), DAX, and FTSE, chosen for their high liquidity, extensive historical data, and representation of diverse economies. This allows for an assessment of the strategy’s effectiveness across various market conditions.
Timeframe: Intraday Data (15-Minute Candlesticks)
The strategy uses 15-minute candlestick intraday data, providing a higher frequency of observations and capturing short-term trading opportunities while balancing computational needs.
Sample Period: Extensive Historical Data
An extensive dataset spanning over 13 years ensures statistical reliability and covers different market cycles (bullish, bearish, sideways), testing the strategy’s adaptability.
Data Preprocessing Steps
Cleaning: Removing errors or outliers, including data issues from market closures or extreme events.
Normalization: Standardizing price data across different indexes to maintain consistent weight matrix performance.
Handling Missing Values: Filling data gaps using interpolation or forward-filling for continuity.
Time Alignment: Synchronizing timestamps to ensure uniformity across different indexes.
Pattern Recognition Technique

Detailed Explanation of the Weight Matrix Approach
A weight matrix overlays a 10x10 grid on the price data window. The initial seven columns represent the flagpole (sharp movement), and the last three cover the flag (consolidation).
Positive Weights: Align with expected price movements in the pattern.
Negative Weights: Discourage deviations from the expected pattern.
Neutral Weights: Provide flexibility without affecting the fitting value.
Calculation of the Fitting Value
The fitting value is calculated by summing the products of price movements and their corresponding weights:

A high fitting value signals a strong match to the flag pattern.
Threshold Setting for Pattern Identification
A threshold fitting value determines if a price window qualifies as a flag pattern. High thresholds reduce false positives but may miss opportunities; low thresholds identify more patterns but increase false positives. The threshold is set through empirical testing to balance accuracy and signal frequency.
Trading Rule Specification
A trade is initiated when the fitting value surpasses the threshold:
Bullish Flag: Triggers a buy operation.
Bearish Flag: Triggers a sell operation.
Trades are executed at the opening price of the next candlestick following pattern confirmation.
Exit Criteria
Stop Loss (SL) and Take Profit (TP) Levels

Trades close when SL or TP is hit, ensuring controlled risk and consistent profit-taking.
Parameter Configuration
Multiple Configurations: Thresholds, SL, TP
Different combinations of thresholds, SL, and TP levels are tested to find the most effective setup. Testing covers various values (e.g., thresholds of 2, 3, 4, 5; SL multiples of 0.2 to 0.8; TP multiples up to 2.0). This results in 96 configurations, each assessed for total return (TR), average return (AR), hit ratio (HR), and maximum drawdown (MD).
Risk Management
Maximum Drawdown (MD) as a Risk Metric
MD measures the largest peak-to-trough decline, indicating potential loss. It is calculated as: