

Python Data Visualization Tutorial
This article demos Python data visualizations on the Iris dataset

We'll use three libraries for this tutorial: pandas, matplotlib, and seaborn.
# First, we'll import pandas, a data processing and CSV file I/O library
import pandas as pd

# We'll also import seaborn, a Python graphing library
import warnings # current version of seaborn generates a bunch of warnings that we'll ignore
warnings.filterwarnings("ignore")
import seaborn as sns
import matplotlib.pyplot as plt
sns.set(style="white", color_codes=True)

# Next, we'll load the Iris flower dataset, which is in the "../input/" directory
iris = pd.read_csv("../input/Iris.csv") # the iris dataset is now a Pandas DataFrame

# Let's see what's in the iris data - Jupyter notebooks print the result of the last thing you do
iris.head()

# Press shift+enter to execute this cell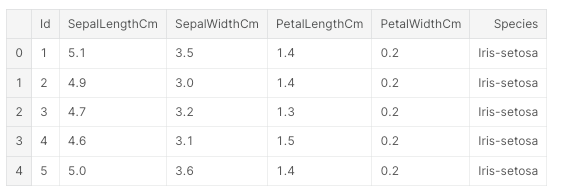
You can also watch the video:
