

Revolutionizing Financial Trading: Leveraging Image Classification for Enhanced Market Analysis
Transforming Time-Series Data into Visual Patterns with Machine Learning to Uncover New Trading Insights and Automate Decision-Making

Listen to this article as a podcast, instead of reading.
Link to download source code at the end of this article.
Every morning on bustling trading floors, seasoned professionals meticulously examine rows of candlestick charts displayed on their multiple monitors. Their eyes dart across intricate patterns, seeking subtle signals that might indicate the next big buy or sell opportunity. These visual representations of market data are not just charts; they are the lifeblood of trading strategies, encapsulating decades of market behavior and trader intuition. Imagine if machines could replicate this nuanced pattern recognition with the same, or even greater, precision and speed. What transformative potential would this hold for the world of financial trading?
Background Context
Financial trading has long been dominated by the rigorous analysis of time-series data — sequential data points that track the performance of financial instruments over time. Traders and analysts scrutinize metrics such as stock prices, trading volumes, and economic indicators, employing a variety of technical analysis tools to forecast future market movements. Traditional methods hinge on mathematical and statistical techniques, utilizing indicators like Moving Averages, Bollinger Bands, Moving Average Convergence Divergence (MACD), and Relative Strength Index (RSI). These tools help in identifying trends, gauging market momentum, and signaling potential entry or exit points in the market.
Time-series analysis in finance involves dissecting historical data to uncover patterns and correlations that can inform trading decisions. For instance, a rising Moving Average might suggest an upward trend, prompting a buy signal, while a declining RSI could indicate an oversold condition, signaling a potential reversal. Despite their widespread use, these methods often require manual interpretation and are limited by the trader’s ability to process and react to complex data swiftly. Additionally, the sheer volume and velocity of financial data in today’s markets pose significant challenges for traditional analytical approaches, necessitating more advanced and automated solutions.
Emerging Intersection
In recent years, the fields of quantitative finance and computer vision have begun to converge, opening up innovative avenues for enhancing trading strategies. Quantitative finance leverages mathematical models and statistical techniques to analyze financial markets, while computer vision focuses on enabling machines to interpret and understand visual information from the world. This intersection paves the way for novel methodologies that transform financial data into visual formats, allowing sophisticated image classification algorithms to detect intricate patterns and signals that might be imperceptible to the human eye.
The advent of deep learning and convolutional neural networks (CNNs) has revolutionized computer vision, enabling machines to achieve human-like accuracy in image recognition tasks. These advancements inspire the application of similar technologies to financial trading, where time-series data can be visualized as images and subjected to powerful classification algorithms. By treating financial charts as visual objects, it becomes possible to harness the full potential of machine learning models to automate and refine the process of identifying trading signals. This fusion not only enhances the efficiency of data analysis but also uncovers new dimensions of market behavior through advanced pattern recognition.
Purpose and Scope
This article delves into the transformative potential of converting financial time-series data into visual representations and applying image classification techniques to enhance trading decision-making. It explores how leveraging computer vision methodologies can bridge the gap between traditional quantitative analysis and the intuitive pattern recognition employed by human traders. By examining the process of encoding financial metrics into images such as candlestick charts and employing machine learning classifiers, the article aims to demonstrate the efficacy and advantages of this innovative approach.
The discussion encompasses the entire workflow — from data preparation and visualization to the application of various machine learning models and the evaluation of their performance in identifying trading signals. It also highlights the practical implications of this methodology, including its potential to automate trading strategies, improve decision accuracy, and adapt to the dynamic nature of financial markets. Furthermore, the article addresses the challenges and limitations inherent in this approach, offering insights into future directions and areas for further research.
Ultimately, the objective is to provide a comprehensive understanding of how transforming numerical financial data into images and utilizing image classification algorithms can revolutionize trading strategies. By bridging the disciplines of quantitative finance and computer vision, this approach promises to enhance the sophistication and effectiveness of automated trading systems, empowering traders with more reliable and actionable insights derived from complex market data.
Traditional Financial Trading Methods
Time-Series Analysis
Definition and Importance
Time-series data refers to a sequence of data points collected or recorded at successive points in time, typically at uniform intervals. In the realm of financial trading, time-series data is fundamental as it captures the historical performance of financial instruments such as stocks, bonds, commodities, and currencies. This data encompasses various metrics, including opening and closing prices, highest and lowest prices within a trading period, and trading volumes. By analyzing these data points over time, traders and analysts can identify patterns, trends, and anomalies that inform their trading strategies and decision-making processes.
The importance of time-series analysis in finance cannot be overstated. It serves as the backbone for understanding market behavior, forecasting future price movements, and assessing the risk and return profiles of different financial instruments. Time-series analysis enables traders to decode the complex dynamics of financial markets, which are influenced by a myriad of factors including economic indicators, geopolitical events, and investor sentiment. By systematically examining historical data, traders can develop insights into market cycles, volatility, and momentum, all of which are crucial for executing informed trades.
Common Techniques
Several traditional techniques are employed in time-series analysis to interpret financial data and generate actionable trading signals. Among the most prevalent are Moving Averages, Bollinger Bands, Moving Average Convergence Divergence (MACD), and the Relative Strength Index (RSI).
Moving Averages (MA):
Simple Moving Average (SMA): Calculates the average price of a security over a specified number of periods. For example, a 50-day SMA smooths out price data to identify the underlying trend.
Exponential Moving Average (EMA): Similar to SMA but gives more weight to recent prices, making it more responsive to new information. EMAs are often used to identify short-term trends.
Moving averages help in smoothing out price fluctuations, making it easier to identify the direction of the trend. They are commonly used to generate buy or sell signals when shorter-term averages cross above or below longer-term averages.
Bollinger Bands: Bollinger Bands consist of a middle band (typically a 20-day SMA) and two outer bands set two standard deviations above and below the middle band. These bands expand and contract based on market volatility. When the price approaches the lower band, it may indicate an oversold condition, suggesting a potential buying opportunity. Conversely, nearing the upper band could signal an overbought condition, hinting at a possible sell.
Bollinger Bands are instrumental in assessing the volatility and identifying potential reversal points in the market.
Moving Average Convergence Divergence (MACD): The MACD is a momentum indicator that calculates the difference between two EMAs (commonly the 12-day and 26-day EMAs). A signal line, which is the 9-day EMA of the MACD, is then plotted alongside. When the MACD crosses above the signal line, it generates a bullish signal, suggesting upward momentum. Conversely, a cross below the signal line indicates bearish momentum.
MACD helps traders identify changes in the strength, direction, momentum, and duration of a trend in a stock’s price.
Relative Strength Index (RSI): RSI is a momentum oscillator that measures the speed and change of price movements on a scale of 0 to 100. Typically, an RSI above 70 indicates that a security is overbought, while an RSI below 30 suggests it is oversold. Traders use these thresholds to identify potential reversal points.
RSI is valuable for gauging the strength of a current trend and identifying potential reversal points based on overbought or oversold conditions.
Technical Indicators
Overview
Technical indicators are mathematical calculations derived from historical price, volume, or open interest data of a security. They are designed to forecast future price movements and assist traders in making informed decisions. Unlike fundamental analysis, which evaluates a security’s intrinsic value based on economic factors, technical indicators focus solely on the price and volume data to identify trading opportunities.
Some of the most widely used technical indicators include:
Moving Averages (MA): As discussed earlier, MAs smooth out price data to identify trends.
Bollinger Bands: Measure market volatility and identify overbought or oversold conditions.
MACD: Combines moving averages to assess momentum and trend direction.
RSI: Evaluates the speed and change of price movements to identify overbought or oversold conditions.
Stochastic Oscillator: Compares a security’s closing price to its price range over a specific period, identifying potential reversal points.
Fibonacci Retracement: Uses horizontal lines to indicate areas of support or resistance at key Fibonacci levels before the price continues in the original direction.
These indicators are often used in combination to validate trading signals and enhance the robustness of trading strategies. They provide a structured approach to analyzing market data, helping traders to discern patterns and make objective decisions.
Limitations
Despite their widespread use, relying solely on technical indicators and manual pattern recognition presents several challenges and limitations:
Lagging Indicators: Many technical indicators, such as moving averages, are based on historical data and thus lag behind current market conditions. This delay can result in late entry or exit points, potentially reducing the profitability of trades.
False Signals: Technical indicators can generate false signals, especially in volatile or sideways markets where price movements are erratic and do not follow clear trends. This can lead to erroneous buy or sell decisions, increasing the risk of losses.
Overfitting: Traders may inadvertently overfit their strategies to historical data, optimizing indicators to perform well on past data but failing to generalize effectively to future market conditions. This can result in strategies that perform poorly in live trading environments.
Subjectivity: The interpretation of technical indicators can be subjective, with different traders drawing varying conclusions from the same set of data. This lack of standardization can lead to inconsistencies in trading decisions.
Market Efficiency: According to the Efficient Market Hypothesis (EMH), it is impossible to consistently achieve higher returns than the overall market through technical analysis alone, as all known information is already reflected in asset prices. This challenges the effectiveness of technical indicators in generating superior trading performance.
Ignoring Fundamental Factors: Technical analysis focuses on price and volume data, often neglecting fundamental factors such as economic indicators, company performance, and geopolitical events that can significantly impact market movements. Ignoring these factors can lead to incomplete analysis and suboptimal trading decisions.
Complexity and Noise: Financial markets generate vast amounts of data, and distinguishing meaningful signals from noise can be challenging. The complexity of interpreting multiple technical indicators simultaneously can overwhelm traders and obscure clear trading signals.
The Power of Visual Representation
Human Intuition in Trading
Visual Analysis
In the fast-paced environment of financial trading, time is of the essence. Traders must make swift decisions based on the constant influx of market data. Visual analysis serves as a critical tool in this process, allowing traders to interpret complex information rapidly and efficiently. Charts, such as candlestick or bar charts, provide a graphical representation of price movements over time, encapsulating vast amounts of data in an easily interpretable format. These visual tools enable traders to quickly assess market conditions, identify trends, and spot potential trading opportunities without delving into the minutiae of raw numerical data.
For instance, a candlestick chart not only shows the opening and closing prices of a security but also highlights the highest and lowest prices within a specific period. The shape and color of each candlestick convey essential information about market sentiment — whether it is bullish (indicating rising prices) or bearish (indicating falling prices). By scanning these charts, traders can gain an immediate sense of the market’s direction and volatility, facilitating rapid decision-making that is crucial in executing timely trades.
Pattern Recognition
Beyond mere visualization, human traders rely heavily on pattern recognition to inform their trading strategies. Over years of experience, traders develop an intuitive understanding of recurring chart patterns that historically precede significant market movements. These patterns, such as head and shoulders, double tops and bottoms, and flag formations, serve as visual cues that suggest potential reversals or continuations in price trends.
Pattern recognition taps into the cognitive abilities of traders to discern subtle and often complex relationships within the data. This intuitive process allows traders to anticipate market behavior based on the identification of these patterns, thereby making informed predictions about future price movements. For example, the “cup and handle” pattern is typically interpreted as a bullish signal, suggesting that a stock is likely to experience an upward breakout following the formation of the pattern.
Moreover, the human brain excels at identifying patterns and making sense of chaotic data, a capability that is particularly valuable in the unpredictable and volatile nature of financial markets. This inherent ability to recognize and interpret visual patterns enables traders to make strategic decisions that align with their analysis, enhancing their ability to capitalize on market opportunities effectively.
Inspiration from Computer Vision
Success in Image Classification
The field of computer vision has witnessed remarkable advancements in recent years, particularly with the advent of deep learning models such as Convolutional Neural Networks (CNNs). These models have revolutionized image classification by achieving unprecedented accuracy in recognizing and categorizing complex patterns within images. Breakthroughs like AlexNet, which won the ImageNet Large Scale Visual Recognition Challenge in 2012, demonstrated the superior capability of CNNs to outperform traditional machine learning algorithms in image recognition tasks.
CNNs excel in extracting hierarchical features from images, enabling them to detect intricate patterns and textures that are often imperceptible to the human eye. This ability to autonomously learn and identify relevant features from raw pixel data makes CNNs exceptionally powerful for tasks that require detailed visual analysis. The success of these models in various applications — ranging from medical image diagnosis to autonomous driving — underscores their potential to transform industries reliant on visual data interpretation.
Potential for Finance
Drawing inspiration from the successes of computer vision, there is a burgeoning interest in applying similar techniques to financial data analysis. Financial time-series data, when transformed into visual representations such as candlestick charts or heatmaps, can be treated as images that encapsulate critical market information. By leveraging image classification algorithms, it becomes possible to automate the detection of complex patterns and trading signals that traders traditionally identify through manual analysis.
The potential application of computer vision in finance lies in its ability to enhance the precision and efficiency of trading strategies. Automated image classification can process vast amounts of visual data at speeds unattainable by human traders, identifying subtle patterns that may indicate impending market movements. This not only augments the decision-making process but also mitigates the risk of human error and bias, leading to more objective and data-driven trading strategies.
Moreover, the integration of computer vision with financial analytics opens up new avenues for developing sophisticated trading models. For example, machine learning algorithms can be trained to recognize specific chart patterns associated with high-probability trading signals, enabling the creation of automated trading systems that execute trades based on these visual cues. This convergence of computer vision and finance has the potential to revolutionize traditional trading methodologies, making them more adaptive and responsive to the dynamic nature of financial markets.
Furthermore, the ability to visualize and analyze financial data through the lens of computer vision can uncover previously hidden relationships and dependencies within the data. This deeper level of analysis can lead to the discovery of novel trading strategies and insights, providing traders with a competitive edge in the market. As financial markets continue to evolve, the synergy between human intuition and machine-driven pattern recognition will likely play a pivotal role in shaping the future of trading.
Transforming Time-Series Data into Images
The transformation of financial time-series data into visual representations is a pivotal step in leveraging computer vision techniques for trading strategies. By converting numerical data into images, we can harness the power of image classification algorithms to identify complex patterns and signals that traditional numerical analysis might overlook. This section delves into the comprehensive process of data preparation, various image encoding techniques, and methods to incorporate time dependency into static images.
Data Preparation
Source of Data
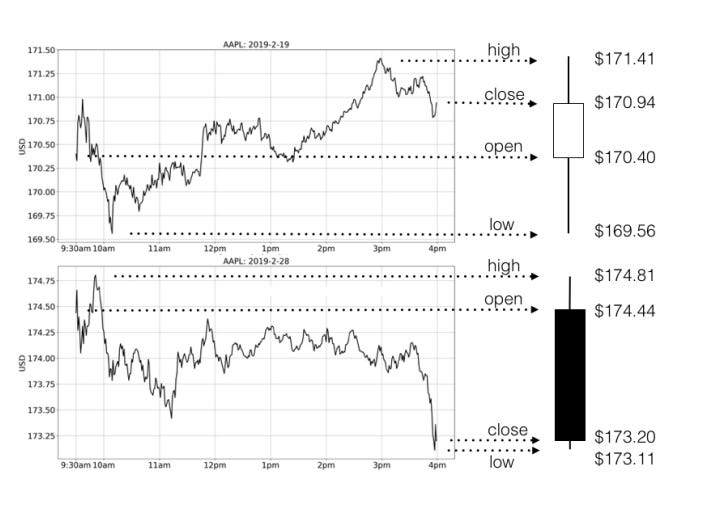
The foundation of any financial analysis lies in the quality and comprehensiveness of the data utilized. For this study, we harnessed daily OHLC (Open, High, Low, Close) data from major stock indices, specifically focusing on the S&P 500 companies over a span of nearly a decade (2010-2018). OHLC data is quintessential in financial trading as it encapsulates the essential price points of a trading period—typically a day. The Open price signifies the first price at which a stock trades upon the opening of the market, while the Close price denotes the final price at which the stock trades at the end of the trading day. The High and Low prices represent the peak and trough of the stock’s price within that period, respectively.
Sourcing data from reliable platforms such as Yahoo Finance ensures accuracy and consistency. The S&P 500, comprising large-cap companies actively traded on American stock exchanges, provides a robust and representative sample of the market, encompassing a diverse range of industries and sectors. This diversity is crucial for training machine learning models that are generalizable across different market conditions and sectors.
Discretization
Financial markets generate continuous streams of data, with prices fluctuating minute by minute during trading hours. However, for the purpose of this analysis, we discretized the continuous time-series data into daily metrics. Discretization involves aggregating continuous data points into distinct, uniform intervals—in this case, daily intervals. This process simplifies the data without significantly compromising the essential information required for analysis.
To discretize the data, we extracted four key metrics for each trading day: Open, High, Low, and Close (OHLC). This method reduces the complexity of the data by summarizing each day’s trading activity into these four pivotal points. The OHLC representation not only captures the daily price range but also provides insights into the market sentiment for that day. For instance, if the Close price is higher than the Open price, it indicates bullish behavior, whereas a lower Close price suggests bearish tendencies.
By discretizing the data into daily metrics, we streamline the input for image encoding, ensuring that each image encapsulates a manageable and meaningful snapshot of market activity. This approach balances the granularity of the data with the computational efficiency required for processing large datasets in image classification tasks.
Image Encoding Techniques
Candlestick Charts
Candlestick charts, also known as box-and-whisker charts in finance, are a widely used visual tool that encapsulates OHLC data in a single graphical representation. Each candlestick represents one trading day and provides a visual summary of the price movements within that period. The process of converting OHLC data into candlestick charts involves several key steps:
Structure of a Candlestick:
Body: The rectangular section of the candlestick displays the Open and Close prices. If the Close price is higher than the Open price, the body is typically colored white or green, indicating a bullish day. Conversely, if the Close price is lower than the Open price, the body is colored black or red, signifying a bearish day.
Wicks (Shadows): The lines extending above and below the body represent the High and Low prices, respectively. The upper wick shows the highest price reached during the day, while the lower wick indicates the lowest price.
Color-Coding for Market Trends:
Bullish Candles: A white or green candlestick indicates that the stock closed higher than it opened, suggesting buying pressure and potential upward momentum.
Bearish Candles: A black or red candlestick signifies that the stock closed lower than it opened, indicating selling pressure and potential downward momentum.
Rendering the Chart:
Using graphical libraries, each OHLC data point is translated into a candlestick with appropriate dimensions and colors based on the day's performance. Consistent scaling ensures that the charts are comparable across different stocks and time periods.
Candlestick charts are particularly effective because they provide a clear and concise visual summary of daily trading activity, allowing traders to quickly assess market sentiment and identify potential trading opportunities based on the formation and interaction of candlesticks.
Alternative Visual Designs
While candlestick charts are a staple in financial analysis, exploring alternative visual representations can uncover additional insights and enhance the efficacy of image classification models. Several alternative designs were experimented with to determine the most effective way to encode time-series data into images:
Line Charts:
Description: Line charts plot the Close prices over time, connecting data points with continuous lines.
Advantages: They offer a simple and uncluttered view of price trends, making it easier to identify overall direction and momentum.
Use Case: Line charts serve as a benchmark performance level, providing a clear reference for evaluating the effectiveness of more complex visual representations.
Varying Bar Widths:
Description: This technique involves varying the width of the candlesticks or bars based on certain criteria, such as the time elapsed or the magnitude of price changes.
Advantages: Varying widths can highlight periods of high volatility or significant price movements, adding another layer of information to the visual representation.
Use Case: This method aims to explicitly represent the progression of time or the intensity of trading activity within the image.
Overlaying Previous Close Values:
Description: Overlaying the previous day’s Close price as a horizontal line on each candlestick provides additional context for each trading day.
Advantages: This overlay helps in comparing consecutive trading days, identifying patterns such as gaps, continuations, or reversals.
Use Case: Enhancing the temporal context within each image, making it easier for classification models to recognize sequential patterns and dependencies.
Incorporating Trade Volume:
Description: Adding trade volume data by varying the width or height of candlesticks based on the volume traded.
Advantages: Volume is a crucial indicator of market strength and conviction. Visualizing volume alongside price movements can provide insights into the sustainability of trends and the likelihood of reversals.
Use Case: Encoding volume information helps classification models discern between genuine trends supported by strong trading activity and false signals generated by low-volume fluctuations.
Heatmaps and Color Gradients:
Description: Applying color gradients or heatmaps to represent additional dimensions of data, such as volatility or momentum.
Advantages: Heatmaps can encode multiple variables within a single image, offering a richer dataset for machine learning models to analyze.
Labeling Strategies for Trading Signals
Effective labeling of data is crucial in supervised machine learning, as it directly influences the model’s ability to learn and make accurate predictions. In the context of transforming financial time-series data into images for trading, labeling strategies must be meticulously designed to capture meaningful trading signals. This section delves into the binary trade strategies employed to generate buy signals and outlines the comprehensive data labeling process essential for training robust image classification models.
Binary Trade Strategies
Binary trade strategies involve categorizing trading signals into two distinct classes: positive (buy signals) and negative (no buy signals). These strategies are grounded in well-established technical indicators that traders use to identify potential market opportunities. The three primary binary trade strategies explored are Bollinger Bands (BB) Crossing, Moving Average Convergence Divergence (MACD) Crossing, and Relative Strength Index (RSI) Crossing.
Bollinger Bands (BB) Crossing
Definition and Rule: Bollinger Bands, developed by John Bollinger in the 1980s, are a volatility indicator consisting of three lines: a middle band representing a simple moving average (typically 20 days), and two outer bands set two standard deviations above and below the middle band. The BB Crossing strategy focuses on the interaction between the stock’s closing price and the lower Bollinger Band.
Buy Signal Mechanism: A buy opportunity is signaled when the stock’s closing price crosses above the lower Bollinger Band. This crossing suggests that the stock was in an oversold condition, meaning its price has fallen significantly and may be due for a rebound. The rationale is that the stock’s price is likely to revert to the mean (the middle band), presenting a favorable entry point for traders.
Example Scenario: Consider a stock whose closing price has been declining, pushing it towards the lower Bollinger Band. When the closing price breaches above this band, it indicates a potential reversal in momentum, prompting a buy signal.
Moving Average Convergence Divergence (MACD) Crossing
Definition and Rule: The Moving Average Convergence Divergence (MACD) is a momentum indicator that highlights the relationship between two exponential moving averages (EMAs) of a stock’s price — typically the 12-day and 26-day EMAs. The MACD line is derived by subtracting the 26-day EMA from the 12-day EMA. A signal line, which is the 9-day EMA of the MACD line, is then plotted alongside the MACD line.
Buy Signal Mechanism: A buy signal is generated when the MACD line crosses above the signal line. This crossover indicates a shift in momentum from bearish to bullish, suggesting that the stock’s price may continue to rise. The MACD Crossing strategy thus leverages the convergence and divergence of moving averages to identify upward trends.
Example Scenario: If a stock’s MACD line rises above its signal line after a period of decline, it signifies increasing upward momentum. Traders interpret this crossover as an opportunity to enter a long position, anticipating further price appreciation.
Relative Strength Index (RSI) Crossing
Definition and Rule: The Relative Strength Index (RSI) is a momentum oscillator that measures the speed and change of price movements on a scale of 0 to 100. Developed by J. Welles Wilder, RSI is used to identify overbought or oversold conditions in a stock. The RSI is calculated based on the average gains and losses over a specified period, typically 14 days.
Buy Signal Mechanism: A buy signal is triggered when the RSI crosses above the oversold threshold, commonly set at 30. An RSI below 30 indicates that the stock may be undervalued and experiencing selling pressure. When the RSI moves back above this threshold, it suggests that the stock is regaining strength, making it a potential buy opportunity.
Example Scenario: A stock with an RSI of 25 indicates oversold conditions. If the RSI subsequently rises to 35, crossing the 30 threshold, it signals a potential reversal and a favorable entry point for traders to purchase the stock.
Data Labeling Process
The data labeling process is integral to training machine learning models effectively. It involves generating labeled images that accurately represent buy and no-buy signals based on the defined binary trade strategies. Ensuring a balanced and representative dataset is essential for the model to learn the underlying patterns without bias.
Sample Creation
Generation of Labeled Images: To train an image classification model, each financial time-series image must be labeled according to the presence or absence of a buy signal. This involves the following steps:
Identification of Signal Points:
For each technical indicator (BB, MACD, RSI), identify the specific points in the time-series data where a buy signal is generated based on the crossing rules.
Image Extraction:
For each identified signal point, extract a window of data leading up to the signal day. This window typically encompasses the number of days required by the indicator to generate a signal (e.g., 20 days for BB).
Image Labeling:
Assign a positive label (buy signal) to images that meet the criteria of the indicator crossing rule.
Assign a negative label (no buy signal) to images that do not meet the criteria.
Balancing the Dataset: To prevent the model from becoming biased towards the majority class, it is essential to create a balanced dataset with an equal number of positive and negative samples. For each indicator, 5,000 positive samples and 5,000 negative samples are generated, resulting in a total of 10,000 images per indicator. This balance ensures that the model has an equal opportunity to learn the characteristics of both buy and no-buy scenarios.
Random Sampling: Within each stock ticker, buy and no-buy signals are sampled randomly to ensure diversity and prevent overfitting to specific patterns unique to individual stocks. By selecting 10 buy signals and 10 no-buy signals per ticker, the dataset captures a wide range of market conditions and trading environments.
Window Sizes
Indicator-Specific Requirements: Each technical indicator has specific requirements regarding the window size, which refers to the number of days of data considered when generating a signal. The window size is determined by the look-back period necessary for the indicator to compute its values and generate a meaningful signal.
Bollinger Bands (BB):
Window Size: 20 days
Rationale: BB calculations typically use a 20-day simple moving average and two standard deviations to set the upper and lower bands. Therefore, a 20-day window captures the necessary data to compute the bands and identify crossings.
Moving Average Convergence Divergence (MACD):
Window Size: 26 days
Rationale: MACD involves calculating the 12-day and 26-day EMAs. The 26-day window ensures that the model has sufficient data to capture the longer-term moving average required for accurate MACD computation.
Relative Strength Index (RSI):
Window Size: 14 days
Rationale: RSI is typically calculated over a 14-day period, assessing the average gains and losses within this window to determine overbought or oversold conditions. A 14-day window is sufficient to reflect the recent price momentum and generate reliable RSI values.
Consistent Window Sizes: Ensuring that each image encapsulates the appropriate window size for its corresponding indicator is crucial for maintaining consistency and relevance in the labeled data. For example, BB images include 20 days of trading data, MACD images include 26 days, and RSI images include 14 days. This consistency allows the classification models to accurately learn the temporal dependencies and patterns specific to each indicator.
Cropping and Standardization: After selecting the appropriate window size, the data is cropped to include only the relevant days leading up to the signal point. This cropping ensures that each image is standardized in terms of the time span it represents, facilitating uniformity across the dataset. Additionally, standardization involves normalizing the OHLC values to a consistent scale, ensuring that variations in price levels across different stocks do not skew the model’s learning process.
Data Augmentation: To further enhance the robustness of the dataset, data augmentation techniques may be employed. This involves creating slight variations of the existing images through transformations such as rotation, scaling, or flipping. Data augmentation helps in increasing the diversity of the training data, enabling the model to generalize better and perform well on unseen data.
Machine Learning Models and Techniques
The efficacy of transforming financial time-series data into images hinges significantly on the selection and implementation of appropriate machine learning models. These models must adeptly interpret the visual representations to discern meaningful trading signals. This section delves into the diverse range of classifiers employed, the critical considerations surrounding image resolution, and the robust training and validation methodologies essential for optimizing model performance.
Selection of Classification Models
Choosing the right classification models is paramount in leveraging the full potential of image-based financial data analysis. A variety of classifiers, each with unique strengths and operational mechanisms, were employed to evaluate their effectiveness in identifying trading signals from financial images.
Logistic Regression
Logistic Regression is a foundational statistical model used for binary classification tasks. It estimates the probability that a given input belongs to a particular class based on a linear combination of input features. Despite its simplicity, Logistic Regression is effective for linearly separable data and serves as a baseline for evaluating more complex models.
Support Vector Machines (SVMs)
SVMs are powerful classifiers that aim to find the optimal hyperplane separating different classes in the feature space. By utilizing kernel functions, SVMs can handle non-linear relationships, making them versatile for various classification tasks. Their robustness against overfitting, especially in high-dimensional spaces, makes them suitable for image-based data.
Decision Trees
Decision Trees operate by recursively partitioning the feature space based on feature values, creating a tree-like model of decisions. They are intuitive and easy to interpret, providing clear insights into the decision-making process. However, they can be prone to overfitting, especially with complex datasets.
Random Forests
Random Forests enhance the Decision Tree approach by aggregating multiple trees to improve generalization and reduce overfitting. Each tree is trained on a random subset of the data and features, and their collective predictions are averaged to produce the final output. This ensemble method significantly boosts classification accuracy and robustness.
AdaBoost
Adaptive Boosting (AdaBoost) is an ensemble technique that combines multiple weak classifiers to form a strong classifier. It assigns higher weights to misclassified instances, ensuring that subsequent classifiers focus more on difficult cases. AdaBoost is effective in improving model accuracy by iteratively refining the decision boundaries.
Gradient Boosting
Gradient Boosting builds an ensemble of trees in a sequential manner, where each new tree corrects the errors of the previous ones. By optimizing a loss function, Gradient Boosting models achieve high predictive performance and are particularly adept at handling complex patterns in data. However, they require careful tuning to prevent overfitting.
Convolutional Neural Networks (CNNs)
CNNs are a cornerstone of modern computer vision, renowned for their ability to automatically extract hierarchical features from images through convolutional layers. They excel in capturing spatial hierarchies and intricate patterns, making them exceptionally suited for image classification tasks. In the context of financial trading, CNNs can identify nuanced patterns in candlestick charts that may indicate trading signals, offering superior performance compared to traditional classifiers.
Image Resolution Considerations
The resolution of input images plays a critical role in the performance of machine learning models. It dictates the level of detail captured in the visual representation, directly influencing the model’s ability to recognize and interpret patterns.
Impact of Resolution
Higher image resolutions retain more detailed information, potentially allowing models to detect finer patterns and subtle variations in the data. However, increased resolution also leads to larger feature spaces, which can introduce noise and increase computational demands. This can result in longer training times and may require more complex models to process the additional information effectively.
Conversely, lower resolutions reduce the complexity of the image data, leading to faster processing and lower computational costs. However, this simplification can cause the loss of critical details necessary for accurate pattern recognition, potentially diminishing the model’s ability to identify meaningful trading signals.
Through empirical analysis, it was observed that classification performance improved with increasing resolution up to a point of diminishing returns. Specifically, a resolution of 30x30 pixels was identified as optimal, striking a balance between retaining essential information and minimizing noise. At this resolution, models were able to achieve high accuracy and precision without the excessive computational overhead associated with higher resolutions.
Downscaling Techniques
To achieve the desired image resolution while preserving vital features, effective downscaling techniques are essential. The Lanczos filter was employed for this purpose due to its superior ability to reduce image size while maintaining sharpness and minimizing aliasing artifacts. The Lanczos filter uses sinc functions to interpolate pixel values, ensuring that the downscaled images retain the structural integrity of the original data.
By applying the Lanczos filter, the images were resized to 30x30 pixels, preserving the critical aspects of the candlestick patterns and other visual indicators. This downscaling method ensures that the models receive clear and consistent input, facilitating accurate pattern recognition and classification.
Training and Validation
Robust training and validation methodologies are crucial to developing machine learning models that generalize well to unseen data. Ensuring that the models are not overfitting and can perform reliably across different datasets is paramount in financial trading applications, where market conditions can vary significantly.
Cross-Validation
5-fold cross-validation was utilized to evaluate the performance of the classification models. This technique involves partitioning the dataset into five equally sized subsets or “folds.” The model is trained on four folds and validated on the remaining fold. This process is repeated five times, with each fold serving as the validation set exactly once. The results from each iteration are then averaged to produce a comprehensive assessment of the model’s performance.
5-fold cross-validation offers several advantages:
Robust Evaluation: It provides a more reliable estimate of model performance compared to a single train-test split by mitigating the variance associated with different data partitions.
Efficient Use of Data: All data points are used for both training and validation, ensuring that the model is exposed to the entire dataset, which is particularly beneficial when dealing with limited data.
Detection of Overfitting: By validating the model on different subsets, cross-validation helps identify if the model is overfitting to specific patterns in the training data rather than learning generalizable features.
Performance Metrics
To assess the effectiveness of the classification models, key performance metrics were employed, focusing on accuracy and precision.
Accuracy:
Definition: Accuracy measures the proportion of correctly classified instances out of the total number of instances. It is a straightforward metric that provides an overall sense of the model’s correctness.

Usage: Accuracy is useful for understanding the general performance of the model. However, it can be misleading in cases of class imbalance, where one class dominates the dataset.
Definition: Precision evaluates the proportion of true positive predictions out of all positive predictions made by the model. It measures the model’s ability to avoid false positives.

Usage: Precision is particularly important in trading applications where the cost of false positives (e.g., entering a trade based on a false signal) can be significant. High precision ensures that when the model predicts a buy signal, it is likely to be correct, thereby reducing unnecessary trades and potential losses.
By leveraging 5-fold cross-validation and focusing on accuracy and precision, the evaluation process ensures that the models are both reliable and effective in identifying genuine trading signals from the visual data. These metrics provide a balanced view of the model’s performance, highlighting its ability to correctly classify instances while minimizing erroneous predictions.
Experimental Results
The experimental phase of this study was pivotal in validating the effectiveness of transforming financial time-series data into images for trading signal classification. By employing a diverse array of machine learning models and meticulously analyzing various factors such as image resolution and time dependency representation, the results offer compelling insights into the viability and robustness of this innovative approach. This section presents the classification performance metrics, resolution analysis, insights into time dependency methods, and the real-world applicability of the developed models.
Classification Performance
Accuracy and Precision Scores
The core objective of this study was to assess the capability of image classification models to accurately identify buy signals based on different technical indicators. The results demonstrated exceptionally high performance for the Bollinger Bands (BB) and Relative Strength Index (RSI) indicators, with both achieving accuracy and precision scores of approximately 95%. This high level of performance underscores the models’ proficiency in recognizing the visual patterns associated with these indicators, which are relatively straightforward and strongly indicative of buy opportunities.
In contrast, the Moving Average Convergence Divergence (MACD) indicator yielded slightly lower, yet still significant, performance metrics, with accuracy and precision scores around 80%. The reduced performance for MACD can be attributed to its inherent complexity, as it involves multiple time scales and the interaction between different moving averages. Despite this complexity, an 80% accuracy and precision rate signifies a robust ability to detect upward momentum signals, demonstrating that the models can effectively handle more sophisticated indicators.
Comparison of Visual Representations
A critical aspect of the experimental results was the comparison of different visual encodings of financial data. Among the various visual representations tested, line plots served as a benchmark, primarily because they directly represent the Close prices, which are the basis for all three technical indicators used. The classification models achieved the highest performance with line plots, validating their effectiveness as a reference standard.
However, the OHLC (Open, High, Low, Close) representations, including candlestick charts and other box-and-whisker designs, demonstrated comparable performance to the line plots. This finding is significant because it suggests that even more complex visual encodings, which provide a richer set of information by incorporating multiple price points, are equally effective for classification tasks. The ability of the models to achieve near-benchmark performance with OHLC representations indicates that these visual formats retain critical information necessary for accurate signal detection, despite their increased complexity.
Furthermore, alternative visual designs such as varying bar widths and overlaying previous Close values were tested. While these modifications introduced additional layers of information, they did not substantially outperform the standard OHLC representations. This outcome highlights that the fundamental structure of OHLC charts is sufficiently informative for the classification models, rendering additional visual modifications unnecessary for enhancing performance in this context.
Resolution Analysis
Optimal Resolution Findings
Image resolution plays a crucial role in the effectiveness of image classification models, as it determines the level of detail captured in the visual representation. Through systematic experimentation, it was observed that classification performance improved as image resolution increased, up to a certain threshold. Specifically, performance metrics — accuracy and precision — showed significant gains as resolutions were enhanced from lower levels (e.g., 10x10 pixels) up to 30x30 pixels.
At 30x30 pixels, both BB and RSI indicators reached their peak performance, with scores stabilizing around 95%. Beyond this resolution, further increases did not yield substantial improvements and, in some cases, led to marginal declines in performance. This plateau suggests that 30x30 pixels is the optimal resolution for balancing detail and computational efficiency. At this resolution, the images retain sufficient information for the models to discern the necessary patterns without introducing excessive noise or computational overhead.
Downscaling Techniques
To achieve the optimal resolution of 30x30 pixels, effective downscaling techniques were employed. The Lanczos filter was chosen for its superior ability to reduce image size while preserving essential features and minimizing aliasing artifacts. The Lanczos filter utilizes sinc functions to interpolate pixel values, ensuring that the structural integrity of the candlestick patterns and other critical visual elements remains intact during the downscaling process.
By applying the Lanczos filter, the high-resolution OHLC images were resized to 30x30 pixels without significant loss of detail. This downscaling method proved effective in maintaining the clarity and distinguishability of key patterns, enabling the classification models to accurately interpret and analyze the visual data. The success of this approach underscores the importance of selecting appropriate downscaling techniques to preserve the informative aspects of financial images while optimizing them for machine learning applications.
Time Dependency Insights
Implicit vs. Explicit Methods
Incorporating the temporal aspect of financial data into static images is essential for capturing the sequential nature of market movements. This study explored two primary methods for embedding time dependency: implicit and explicit approaches.
Implicit Methods: Implicit methods integrate the notion of time within the image labels rather than altering the visual structure. By labeling images based on the presence of a trading signal at the end of the time window, the temporal dependency is inherently conveyed. For instance, a buy signal occurring on the last day of the window implicitly highlights the importance of recent data points. This approach leverages the model’s ability to learn the significance of the signal’s position within the image, effectively encoding time dependency through the label distribution.
The results indicated that implicit methods were highly effective, particularly for the BB and RSI indicators. Models trained with implicitly time-dependent labels achieved high accuracy and precision, demonstrating that the temporal context was successfully captured without the need for additional visual modifications. This method simplifies the data representation while maintaining the critical temporal information necessary for accurate classification.
Explicit Methods: Explicit methods, on the other hand, directly encode the progression of time within the image’s visual structure. Techniques such as varying the width of candlesticks or overlaying previous Close values were employed to make the direction and recency of time unmistakable. For example, increasing the width of candlesticks towards the right side of the image visually emphasizes more recent data points, while overlaying previous Close prices creates a continuous temporal link between consecutive trading days.
However, the experimental results revealed that explicit methods did not significantly enhance model performance and, in some cases, even detracted from it, particularly for the more complex MACD indicator. The additional visual complexity introduced by explicit methods may have introduced noise or distracted the models from the most relevant patterns. Consequently, implicit methods proved to be more effective and efficient in capturing time dependency without complicating the image structure.
