


Revolutionizing Time Series Classification with Semi-Supervised Shapelet Learning
Efficient and Interpretable Approaches to Complex Sequential Data

🎧 Podcast Available: Dive deeper into this article's content through our comprehensive audio version! Available in voiceover. Try it and tell me how it is!
💻 Source Code Access: Download the complete source code accompanying this article at the end of the page.
Time series data plays a pivotal role in numerous fields, including finance, healthcare, and engineering. In finance, stock market trends and economic indicators are classic examples of time series data. Similarly, in healthcare, vital signs such as heart rate, blood pressure, and electrocardiogram (ECG) readings are continuously recorded to monitor patient health. In engineering, time series data is essential for predictive maintenance, analyzing machinery performance, and detecting anomalies in industrial systems. The widespread use of time series data highlights its importance in analyzing and predicting dynamic processes. However, the inherent complexity of this data — characterized by high dimensionality, noise, and irregular patterns — makes its analysis a challenging task. Identifying meaningful patterns amidst this complexity is crucial for accurate predictions and classifications.
A significant challenge in working with time series data is the reliance on labeled datasets for effective machine learning models. Labeled data requires domain expertise to annotate correctly, which is both time-consuming and costly. For instance, annotating medical time series data, such as ECG signals, often necessitates input from specialists. On the other hand, unlabeled data is abundant and relatively easy to collect from various sources. This imbalance between labeled and unlabeled data has created a pressing need for methods that can effectively leverage both types of data.
One promising approach to address this issue involves using discriminative patterns known as shapelets. Shapelets are short, representative subsequences extracted from time series data that are highly effective in distinguishing between different classes. These patterns offer an interpretable and compact representation of the data, making them a valuable tool for classification tasks. The challenge, however, lies in identifying these shapelets efficiently, particularly in scenarios with limited labeled data.
Combining labeled and unlabeled data can significantly enhance the ability to classify time series by expanding the information available for learning. By incorporating unlabeled data into the learning process, models can uncover hidden patterns and relationships that would be inaccessible through labeled data alone. This hybrid approach not only improves classification accuracy but also reduces the dependence on expensive labeled datasets, offering a practical solution to the challenges of time series classification in real-world applications.
Time Series Data
Time series data consists of sequentially ordered data points, often recorded over time intervals. This data type captures the dynamic nature of processes and is prevalent in various domains. For instance, in finance, stock prices are recorded daily or hourly to track market trends. In healthcare, time series data includes electrocardiogram (ECG) signals used to monitor heart health or blood glucose levels tracked over time. Environmental studies use temperature and humidity readings collected hourly to study climate patterns. These examples illustrate the versatility of time series data in reflecting real-world processes and aiding decision-making.
Despite its importance, analyzing time series data presents several challenges. The high dimensionality of time series — where a single instance may contain thousands of data points — can overwhelm traditional methods. Additionally, time series data is often noisy, with random fluctuations that obscure underlying patterns. For example, ECG signals may contain artifacts caused by patient movement, and stock price data may be influenced by market anomalies. The temporal dependencies in time series further complicate analysis, as relationships between data points are non-linear and context-dependent. Efficiently extracting meaningful features from this complex data remains a key hurdle for researchers and practitioners.
Classification in Time Series
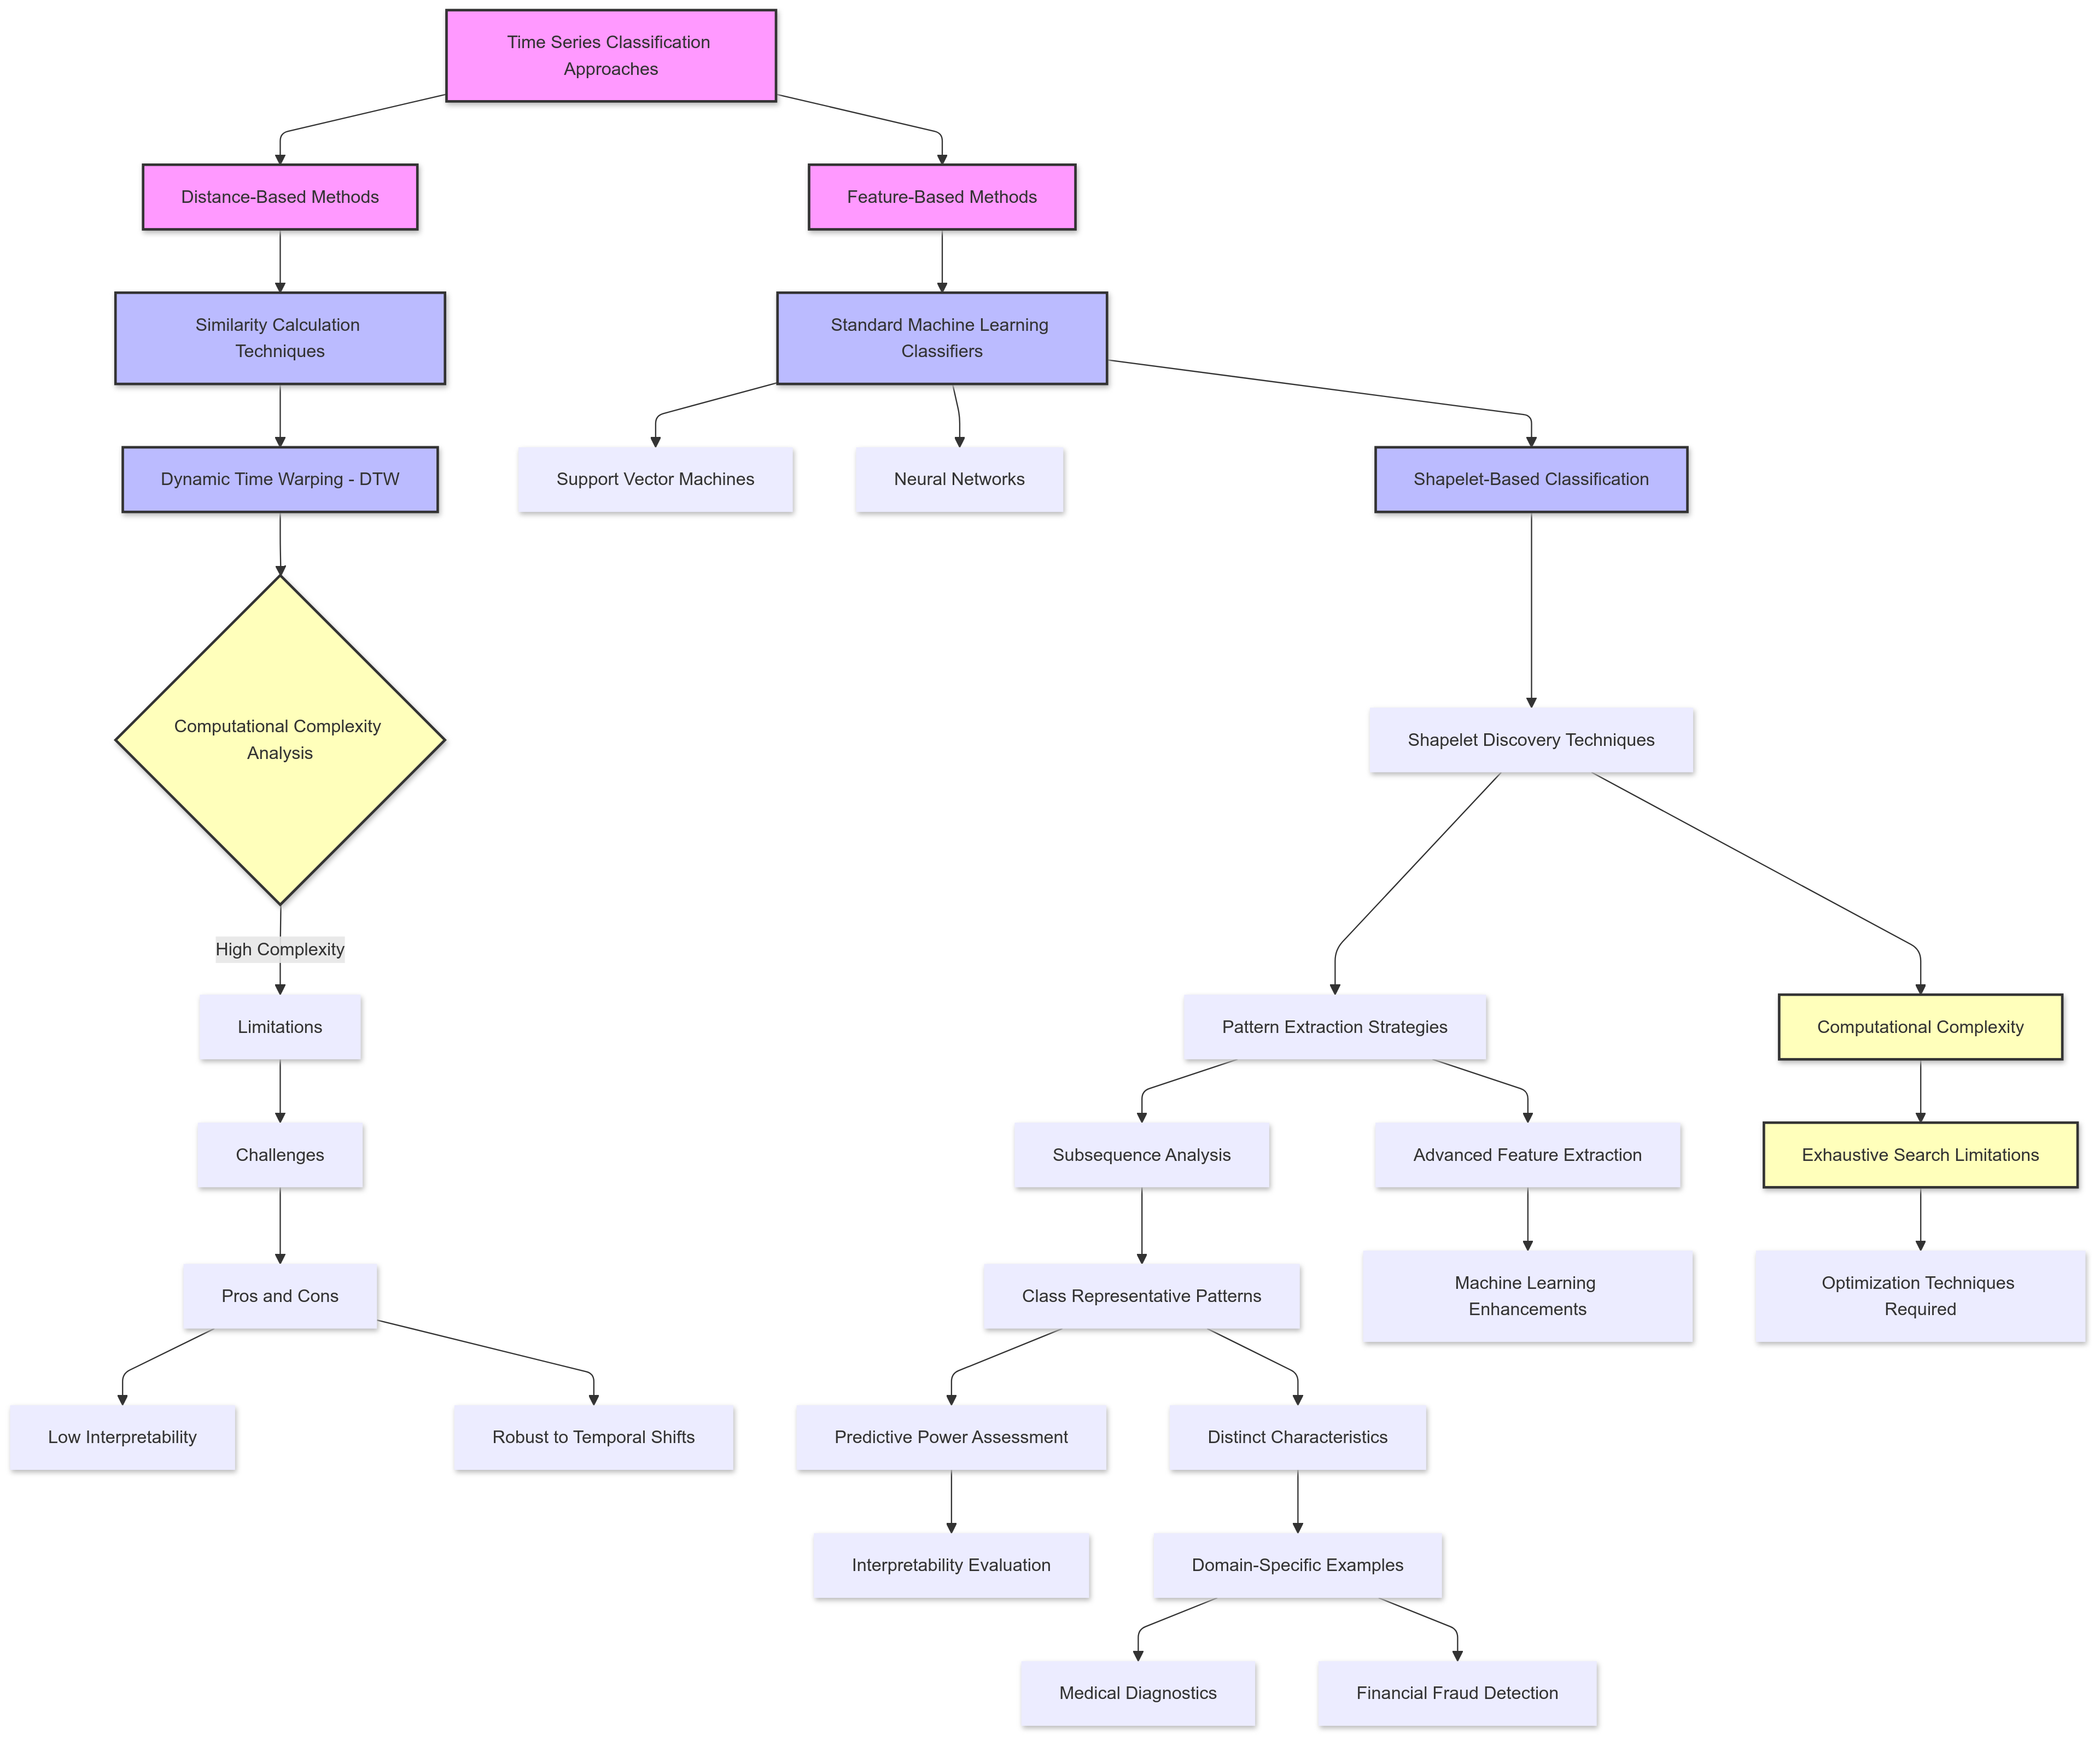
Classifying time series data involves assigning a label to a sequence based on its inherent patterns. This task has widespread applications, such as detecting fraudulent transactions in financial systems or identifying abnormal heart rhythms in medical diagnostics. Over the years, two primary approaches to time series classification have emerged: distance-based methods and feature-based methods.
Distance-Based Methods: These methods calculate the similarity between time series sequences, often using distance measures like Dynamic Time Warping (DTW). DTW aligns sequences by stretching or compressing time to find the optimal match, making it robust to temporal shifts. While effective for small datasets, distance-based methods are computationally expensive and often lack interpretability. They provide little insight into which aspects of the data contribute to classification.
Feature-Based Methods: In contrast, feature-based methods treat time series data as feature vectors, enabling the use of standard classifiers like support vector machines (SVMs) or neural networks. These approaches rely on extracting meaningful features from the data, such as statistical summaries or domain-specific characteristics. A prominent advancement in feature-based methods is the introduction of shapelets.
Shapelets are short, subsequential patterns within time series that are maximally representative of a particular class. For example, a distinct spike in an ECG signal could act as a shapelet for detecting arrhythmia. Shapelets offer two critical advantages: high predictive power and interpretability. They pinpoint the precise regions in the time series that contribute to classification, making them a valuable tool for understanding the data. However, traditional shapelet discovery methods involve exhaustive searches over all possible subsequences, which is computationally prohibitive for large datasets.
Why Semi-Supervised Learning?
In real-world scenarios, obtaining labeled time series data is often a labor-intensive and costly process. Labels typically require domain expertise; for example, annotating medical signals may involve consultations with healthcare professionals, while labeling environmental data may necessitate extensive fieldwork. This reliance on expert annotation limits the availability of labeled data, especially for large-scale datasets. At the same time, unlabeled data is abundant and easily collected from sensors, databases, or online systems. The disparity between labeled and unlabeled data availability underscores the need for methodologies that can leverage both.
Semi-supervised learning bridges this gap by utilizing a small amount of labeled data alongside a large pool of unlabeled data to train classification models. The underlying assumption is that unlabeled data can provide valuable information about the structure and relationships within the dataset. By incorporating this additional information, semi-supervised models can improve classification performance, even when labeled data is scarce.
One common semi-supervised learning approach involves assigning pseudo-labels to unlabeled data. These tentative labels are generated based on the model’s predictions and iteratively refined during the training process. Another technique uses spectral analysis to ensure that similar data points in the unlabeled set are assigned consistent labels, preserving the local structure of the data.
The inclusion of semi-supervised methods in time series classification is particularly beneficial when combined with shapelet-based models. By leveraging unlabeled data, semi-supervised approaches can identify shapelets more effectively, reducing the reliance on exhaustive searches and labeled examples. This hybrid approach enhances the model’s ability to generalize across diverse datasets, making it a powerful solution for real-world time series classification challenges. Furthermore, it addresses the interpretability gap often associated with traditional machine learning methods, as the extracted shapelets provide clear, interpretable patterns tied to specific classes.
Main Idea and Model
Overview
In the realm of time series classification, one of the most pressing challenges is the scarcity of labeled data, compounded by the complexity of extracting meaningful patterns from sequential data. To address this, a semi-supervised learning framework is designed to utilize both labeled and unlabeled data to identify discriminative patterns called shapelets. This framework is particularly valuable in scenarios where labeling data is costly or infeasible, yet vast amounts of unlabeled data are readily available.
The goal of this framework is to efficiently extract shapelets — short, representative subsequences from time series data — that are capable of distinguishing between classes with high accuracy. By incorporating unlabeled data, the framework not only reduces reliance on labeled samples but also enhances the ability to identify patterns that might otherwise remain hidden. The semi-supervised learning approach combines supervised techniques with methods that leverage the structure of unlabeled data, resulting in a robust classification model.
Shapelets
Definition and Importance
Shapelets are short, ordered subsequences of a time series that are particularly discriminative for classification tasks. Unlike traditional features, which might represent statistical properties or domain-specific characteristics, shapelets capture localized patterns directly within the time series. For example, in medical data, a specific spike in an electrocardiogram (ECG) signal might serve as a shapelet for detecting arrhythmia. Similarly, a unique fluctuation in stock prices could act as a shapelet for identifying market trends.
The power of shapelets lies in their ability to provide interpretable insights. When a shapelet is identified as significant for a particular class, it highlights a specific region of the time series responsible for the classification decision. This interpretability is especially crucial in domains like healthcare, where understanding the basis of a decision can build trust and support further analysis.
High-Performing Features
Shapelets are not only interpretable but also highly effective for classification. By transforming the original time series into a new feature space based on distances to shapelets, the framework simplifies the classification task. Each time series is represented as a vector, where each dimension corresponds to the distance to a particular shapelet. This transformation reduces noise, highlights relevant patterns, and facilitates the application of traditional machine learning algorithms like support vector machines (SVMs) or decision trees.
Traditional shapelet discovery methods rely on exhaustive searches through all possible subsequences of the time series, which is computationally prohibitive. The semi-supervised learning framework addresses this limitation by integrating efficient optimization techniques to directly learn shapelets, bypassing the need for exhaustive candidate generation. This approach ensures that the selected shapelets are maximally representative and discriminative.
Model Goals
The semi-supervised shapelet learning framework is built around three primary objectives:
Extract Diverse and Non-Redundant Shapelets
One of the key challenges in shapelet-based classification is avoiding redundancy. Redundant shapelets — those that represent similar patterns — can lead to inefficiencies and reduced model interpretability. The framework incorporates a regularization mechanism that promotes diversity among the selected shapelets. This ensures that each shapelet contributes unique information to the classification task, improving both accuracy and interpretability.
For instance, in a dataset containing temperature readings, two shapelets that represent nearly identical rising trends may offer little additional value. The model’s ability to penalize such redundancies enables it to focus on distinct patterns that better capture the variability of the data.
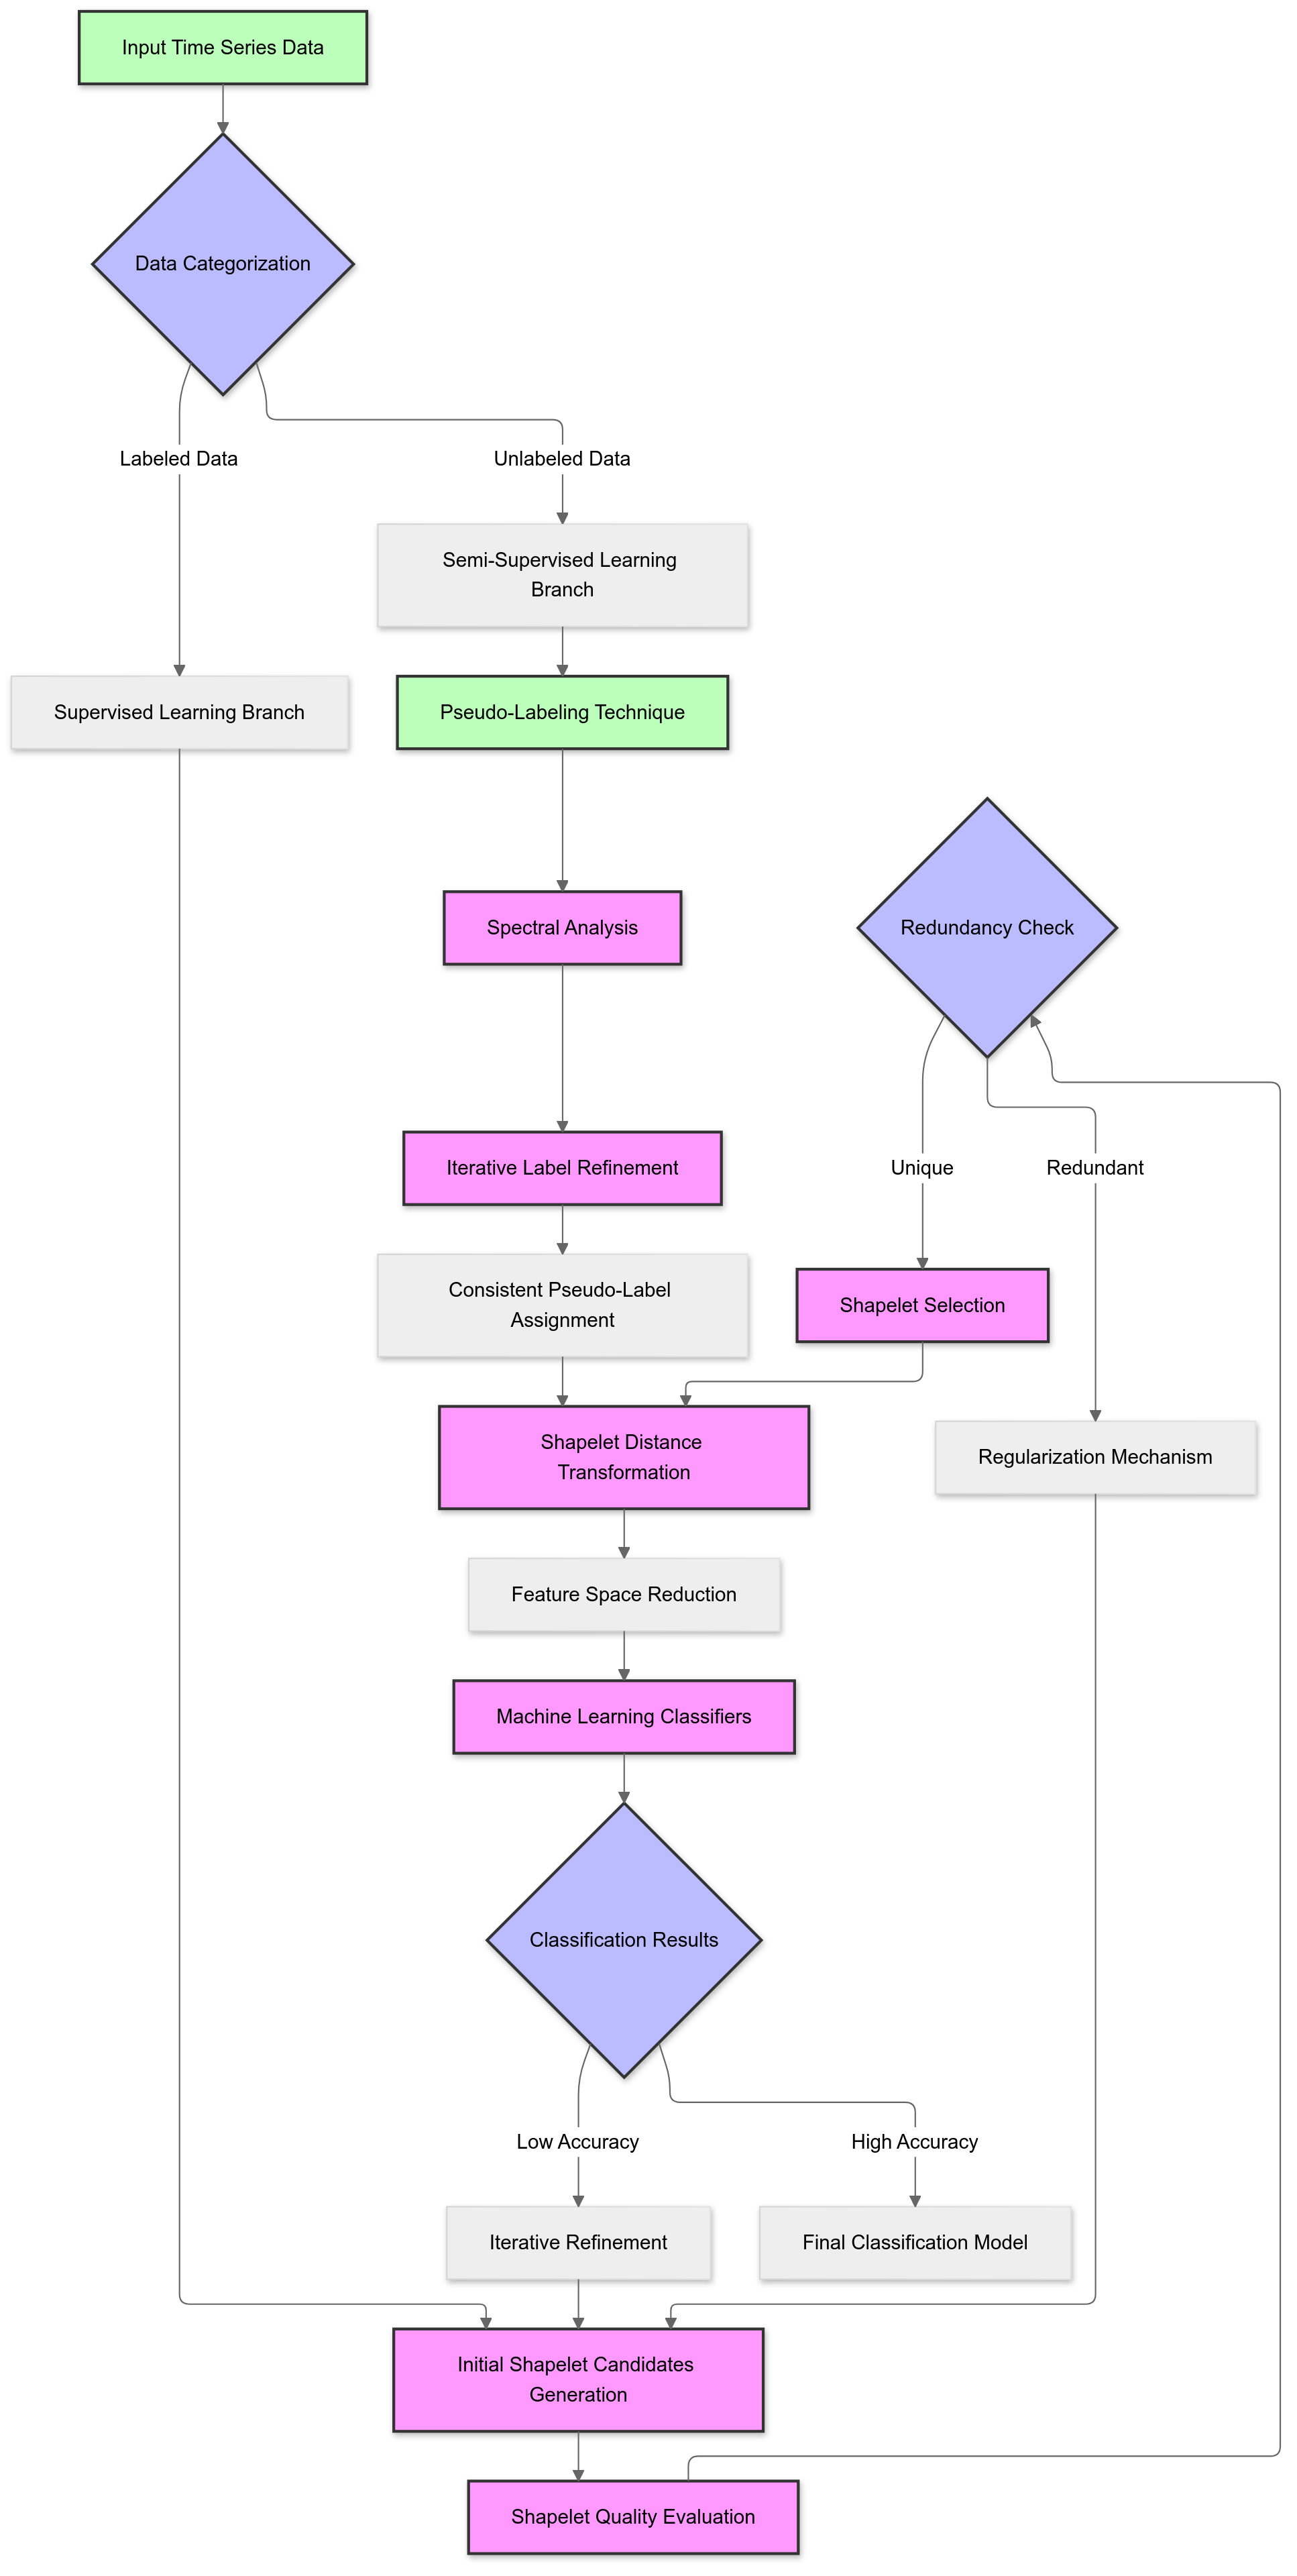
Utilize Unlabeled Data Effectively
The framework leverages unlabeled data through semi-supervised techniques such as pseudo-labeling and spectral analysis. Pseudo-labeling assigns tentative labels to unlabeled samples based on initial model predictions. These pseudo-labels are refined iteratively, allowing the model to extract meaningful patterns even from unlabeled data. Spectral analysis ensures that similar samples in the unlabeled data are assigned consistent pseudo-labels, preserving the data’s inherent structure.
This dual approach enables the model to tap into the wealth of information contained in unlabeled data, effectively expanding the training dataset and enhancing generalization. For example, in a dataset of stock prices, unlabeled data can reveal common trends or anomalies that may not be present in the labeled subset.
Preserve the Local Structure of Data
Preserving the local structure of time series data is critical for capturing meaningful relationships between samples. The framework achieves this through spectral regularization, which ensures that similar samples (based on their shapelet-transformed representations) have similar representations in the learned feature space. By maintaining this local structure, the model aligns its predictions with the natural groupings within the data.
For example, in a dataset of ECG signals, preserving the local structure ensures that signals with similar heart rhythms are classified consistently. This not only improves accuracy but also makes the model’s decisions more aligned with real-world phenomena.
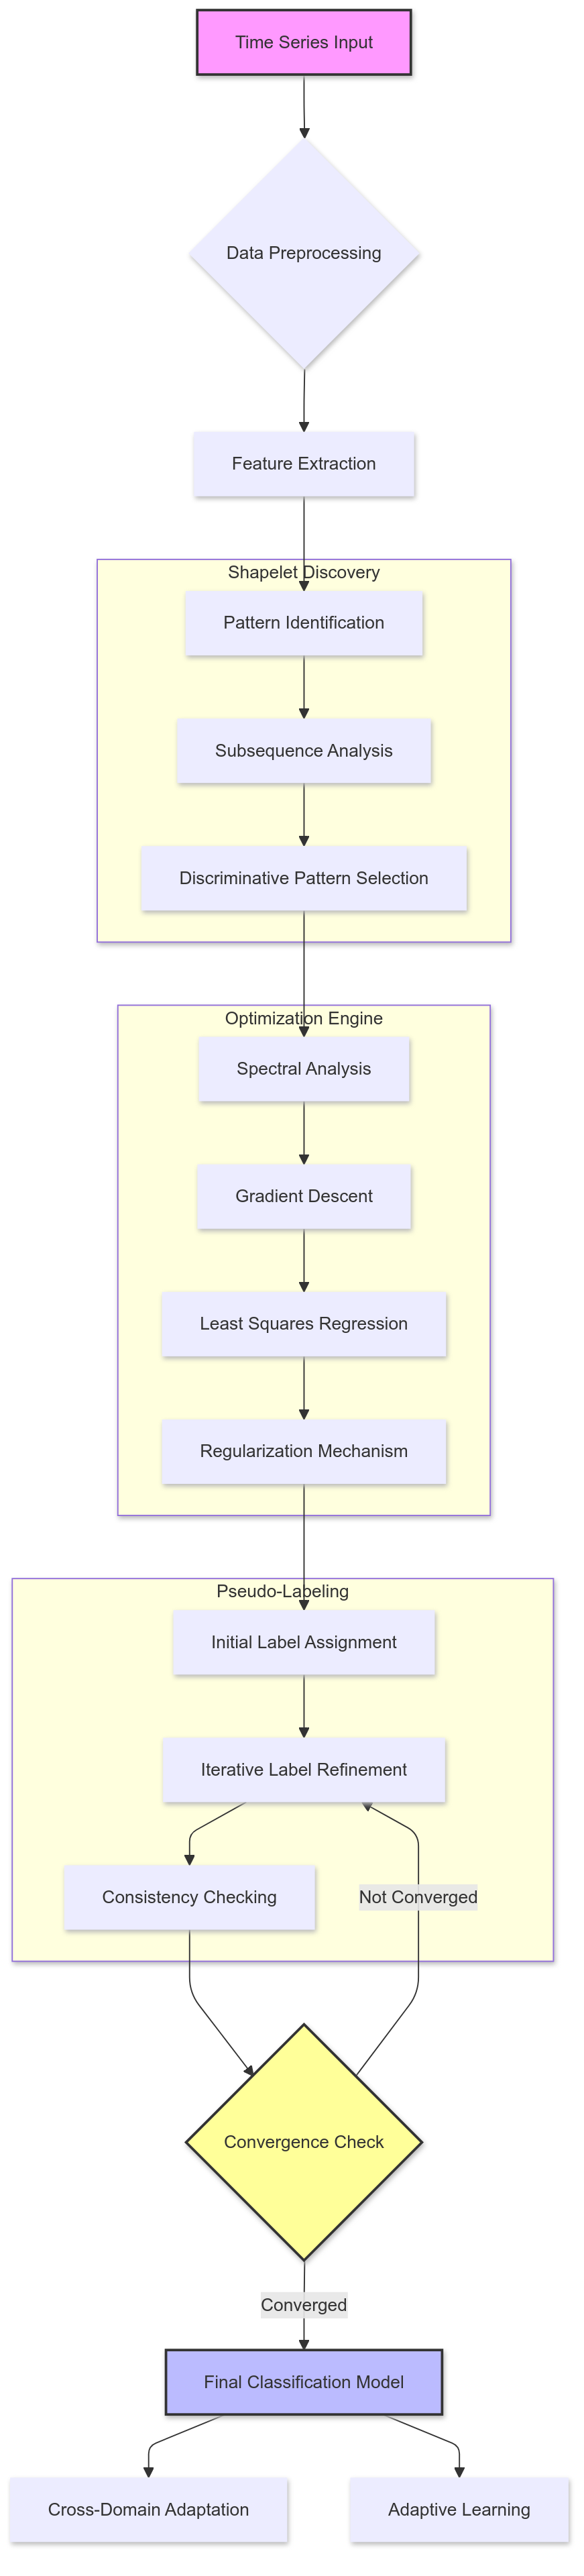
Mechanisms and Working
Data Representation
To make time series data suitable for classification, it is transformed into a shapelet-based feature space. This transformation involves representing each time series by its minimum distances to a set of discriminative shapelets. A shapelet is a short, subsequential pattern that serves as a characteristic feature of the class it represents.
The transformation results in a shapelet-transformed matrix, where each row corresponds to a shapelet, and each column represents a time series. The value at each matrix cell indicates the minimum distance between a shapelet and a time series. This representation achieves two major benefits:
Dimensionality Reduction: The original high-dimensional time series is reduced to a compact vector representation, improving computational efficiency.
Interpretability: By focusing on specific subsequences (shapelets), the transformation highlights the most relevant features for classification, making the model’s decisions easier to understand.
For example, in an electrocardiogram (ECG) dataset, the transformation might capture the distance of each signal to a shapelet representing a distinct peak pattern associated with arrhythmia. This transformation streamlines the data into a space where classification becomes straightforward.
Key Components
1. Spectral Analysis
Spectral analysis is used to ensure that similar time series share similar pseudo-labels. It achieves this by preserving the local structure of the data in the shapelet-transformed space. Specifically, spectral regularization penalizes inconsistencies in the labeling of neighboring time series, encouraging smoother transitions between similar samples.
For example, in a dataset of stock price trends, two time series with similar rising patterns should have closely related pseudo-labels. Spectral analysis ensures such relationships are maintained during the learning process.