

Visualising Bacteria As Image in 2D Using Python
A simple guide to visualise bacteria.

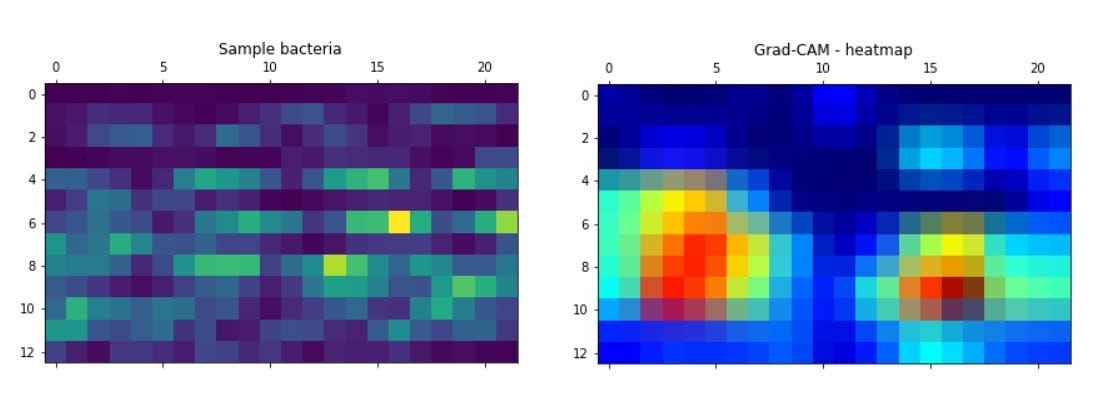
Imagine dataset as a classification problem for images. Every bacterium is represented by an image. How do bacteria appear? In what way does NN deal with this? We'll try some experiments.
You will find the following information in this notebook:
Creating images from tabular data and redefining the problem
2Dconvolution (images) combined with Dense (additional tabular features) for the Keras neural network hybrid model
Cross-validation of NN models with StratifiedKFold - to evaluate models locally
for NN feature mapping
Show parts of the image (bacteria) that influence the choice of the class
in a complex model prediction optimization
Using tabular data as an image or NLP problem (another way of approaching tabular data)
How to utilize magic functions (conditional cell run) - may be useful and replace the if function
Based on duplicates in the training dataset, replacing the target class in the test dataset
The first thing we are going to do is to import all the libraries which we need to work with:
import pandas as pd
import numpy as np
import seaborn as sns
import gc
import os
import time

from scipy.stats import mode
from sklearn.preprocessing import LabelEncoder
from sklearn.model_selection import train_test_split, StratifiedKFold
from sklearn.preprocessing import MinMaxScaler, OneHotEncoder
from sklearn.metrics import accuracy_score

import keras
from keras.models import Sequential
from keras.layers import Dense, Dropout, Flatten
from keras.layers import Conv2D, MaxPooling2D, BatchNormalization
from keras import backend as K
from keras.utils import np_utils
from keras.utils.vis_utils import plot_model
import matplotlib.pyplot as plt
import tensorflow as tf

import matplotlib.cm as cm
from IPython.display import Image, display

import warnings
warnings.filterwarnings("ignore")
Now it’s time to prepare data to continue:
test = pd.read_csv("../input/tabular-playground-series-feb-2022/test.csv", index_col = 'row_id')
train = pd.read_csv("../input/tabular-playground-series-feb-2022/train.csv", index_col = 'row_id')
sub_df = pd.read_csv("../input/tabular-playground-series-feb-2022/sample_submission.csv")

train.drop_duplicates(keep='first', inplace=True)
train = train.reset_index(drop=True)
test = test.reset_index(drop=True)

target = train.target
num_classes = target.nunique()

FEATURES = [col for col in train.columns if col not in ['target']]
This dataset is created only for neural network filter and grad-cm visualization
